You can check:
Microsoft Power BI – Part – I
Microsoft Power BI – Part – II
If you remember in our first post of this series we have downloaded an installed 2 Component/Tool

Today we will discuss and explore Power BI Desktop. It allows you to create the reports from in premise database and create visuals as we saw in our previous posts.
When you launch Power BI Desktop application opens as below:

Which more or less looks like one we saw online PowerBI.com.
Let’s try building one simple report using this tool.
Step-1 We will require some services to be published before we can access data from our in premise database.

For my example I have published two pages Item Card & Vendor Card as a Web Service.
We will use OData URL to fetch data.
Step-2 Launch Power BI Desktop

Step-3 Connect our Data source to create our reports.
Select Get Data from the Home Screen.

Copy the OData URL from the Web Service Page, in my case: http://INDEL-AXT5283N1.TecturaCorp.net:8048/DynamicsNAV80/OData/Company('CRONUS%20International%20Ltd.')/Item_Service
Please take up to Company Name no Service Name required, it will list you all the services exposed from your database installation. In above remove the service name Item_Service from the URL.

On selecting OK you will get list of all Services available in form of Single Query.

If you notice sometimes you may not get the latest list of services available, reason the connection is not refreshed. See the highlighted part in above screen.
Refresh the connection to get latest list of services available.

In above screen show us the currently available services which we can use for creating our report/ visuals.
Step-4 Add available tables to our Dataset.

Right Click on the Table Link and choose “Add as New Query”

Once you add you can find Table Query in the Left Navigation Bar.

You can Browse the Table from the Left hand Navigation Bar and change its Name if required in the Right side “Query Settings”. On the Top of the Query you may find information if available data is old, you can Refresh it to get the updated one.
Here you can perform other operations too to tweak the table as per the requirement.
You can Add new columns deriving data from existing columns using formula and other available methods. You can drop unnecessary columns etc. We will look into same in future posts.
For now we will remove some additional columns which got added due to service.

Select the column Right Click and choose Remove.

Finally we will remove the Source Query created after connecting to OData, Right Click to the Query and choose Delete.

As a Final to this Step we will choose Close & Apply from the Top Left Corner Tool Bar.

You will be returned to main Report Builder Window.
This screen is similar to one we saw while Online Power BI window.
Step-5 We will build Relation between our tables added above.
Let us build the Relation between the Tables we selected.
To define the Relationship Select Relationship view from the Left Navigation Bar.

You will see both the Tables in the Relation Window.
To define relation Click on Vendor No field in Item Table and Drop on No field of Vendor Table.
You will see Many to One Relationship is established between these two Tables. For now we will use this only and come in more details of Managing Relationship in future posts.
Step-6 Create our Report/ Visuals
Return to Report Canvas and add few Fields as we did while our First report using Online Power BI.

For my example I have added Item(No, Inventory, Vendor No, Vendor Item No) Vendor(Name, Location, City, Country Region Code).
Rest I leave up to you how you further categorize and Visualize the report. My objective was to demonstrate how you can create Reports in BI Desktop Tool using your in premise Navision Database installation.
Step-7 Save my Report

Save the Report *.pbix which we can access to modify report in future if required.
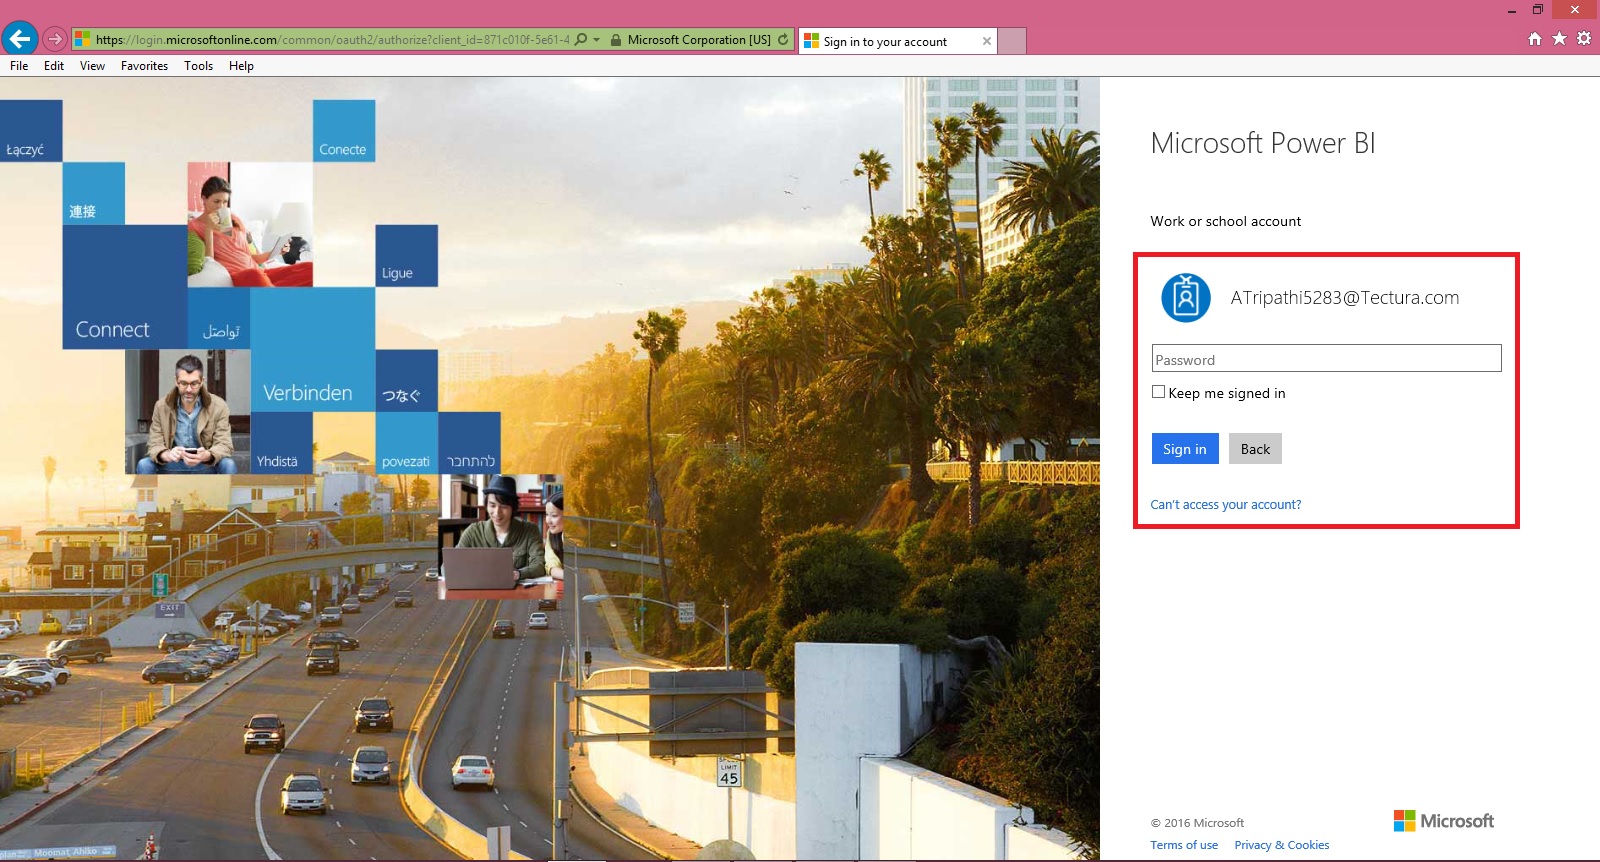
Step-8 Login to PowerBI Online

You will require credentials to your PowerBI online to connect.

Provide your credentials and Sign in.
Once you successfully sign in to your account you can now proceed with next step.
Step-9 Publish the Report to Online Power BI

Once your Report is published successfully you will get below screen

Step-10 Verifying the Report on PowerBI.com

Sign in using your credentials to PowerBI.com

Great, the report we published from BI Desktop is now available Online.
That’s all for today.
Truth is we have created the Report using in premise database, it should be in sync with latest data from our database. But this will not at this moment.
In our next post we will work on how to keep the data of this dataset in sync with the data from our in premise database.
Till then keep exploring and learning new features available with Power BI.
[…] Microsoft Power BI – Part – III […]
ReplyDelete[…] Microsoft Power BI – Part – III […]
ReplyDelete[…] Microsoft Power BI – Part – III […]
ReplyDelete[…] Microsoft Power BI – Part – III […]
ReplyDelete[…] Microsoft Power BI – Part – III […]
ReplyDelete