Helpful blog for Integrating Dynamics NAV 2016 with CRM Online
Please see this post may help you in getting your task done.
Thursday, 31 March 2016
Microsoft Power BI – Part X
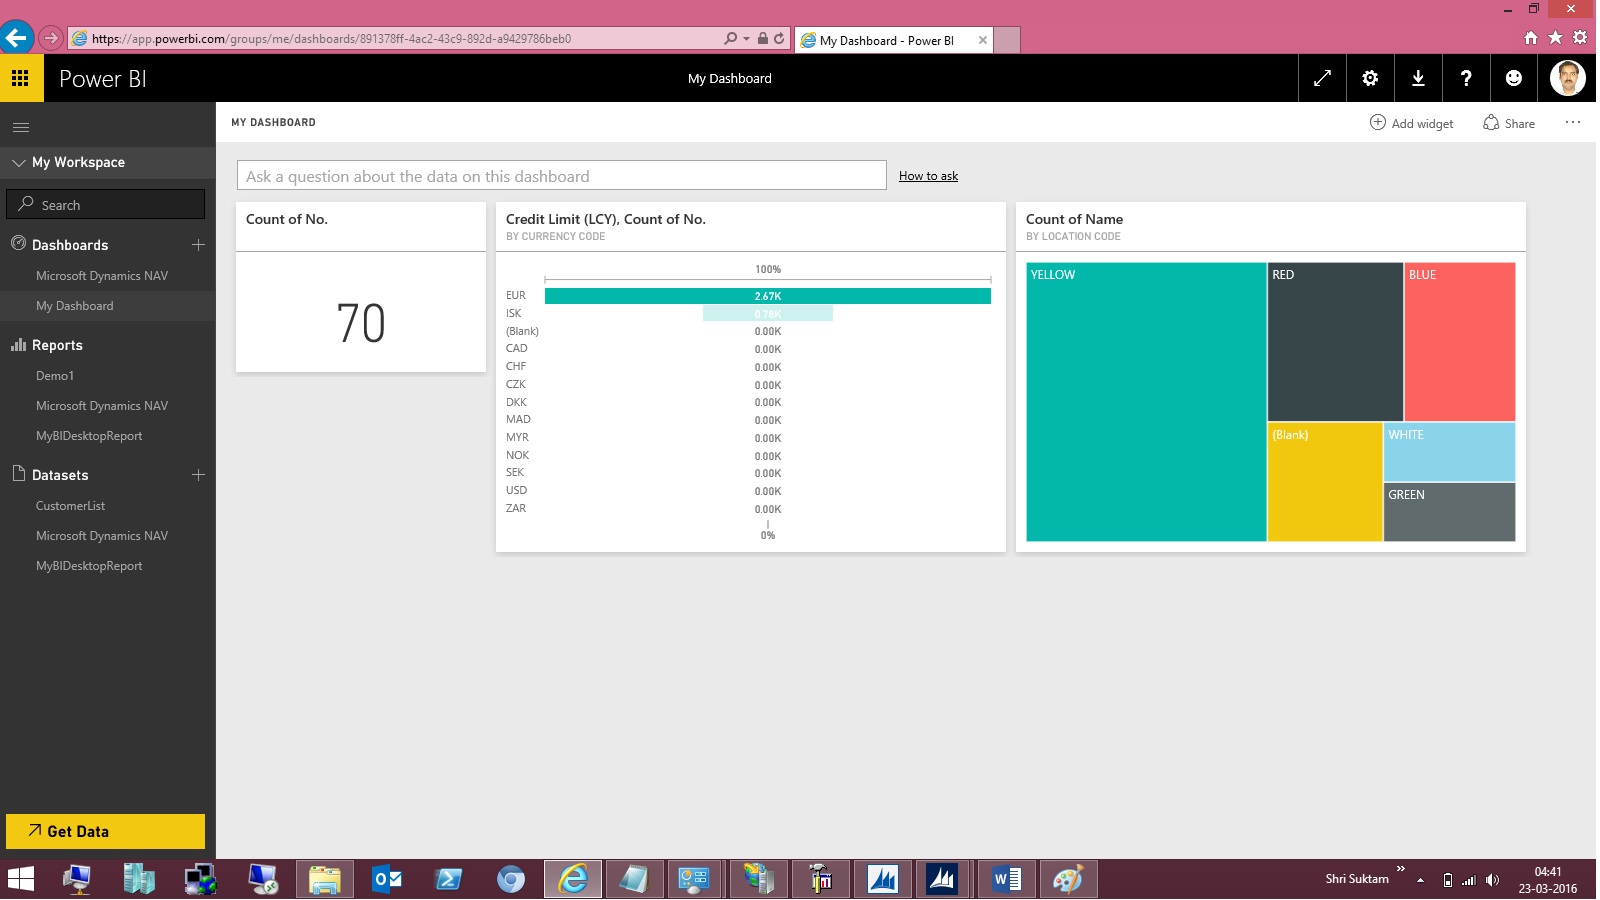
Continuing from my previous post. Today we will downloading the dataset into Excel from Power BI Online for analysis.
In case you have missed my previous posts here I present the link to all previous posts below.
Microsoft Power BI – Part – I
Introduction to Power BI and Creating Report from Excel Data, Local Files.
Microsoft Power BI – Part – II
Introduction to few Features of Power BI
Microsoft Power BI – Part – III
Power BI Desktop, Creating Dataset & Reports from In Premise Database installation
Microsoft Power BI – Part – IV
Power BI Gateway usage
Microsoft Power BI – Part – V
Scheduling Refresh of Dataset & Report created using In Premise Database
Microsoft Power BI – Part – VI
Power BI Content Pack
Microsoft Power BI – Part – VII
Power BI Mobile App
Microsoft Power BI – Part – VIII
Power BI Content Pack
Microsoft Power BI – Part – IX
Power BI Publisher for Excel
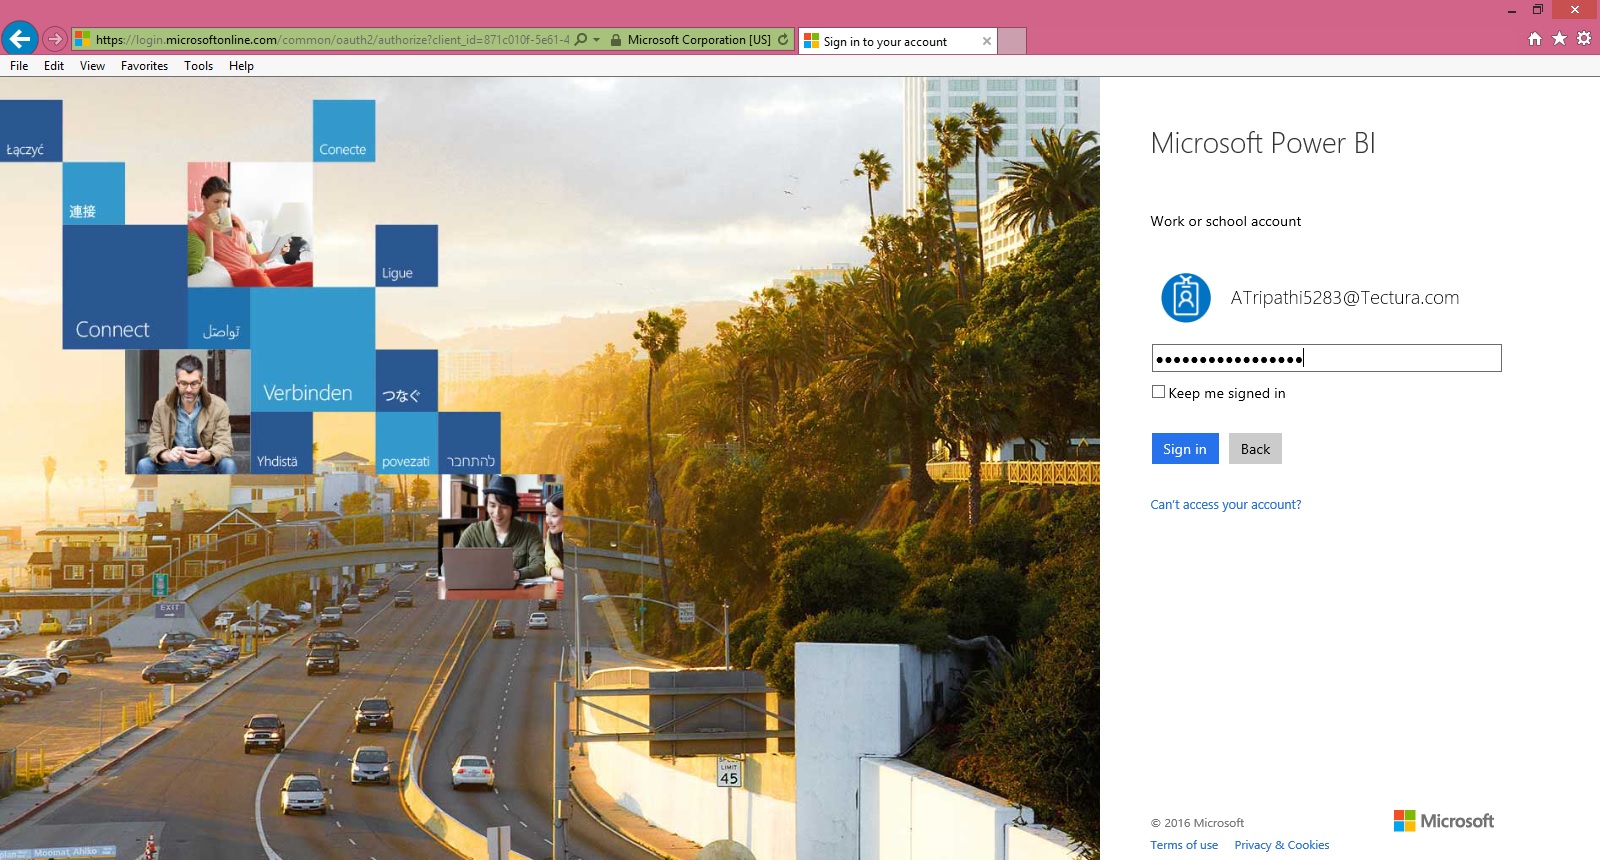
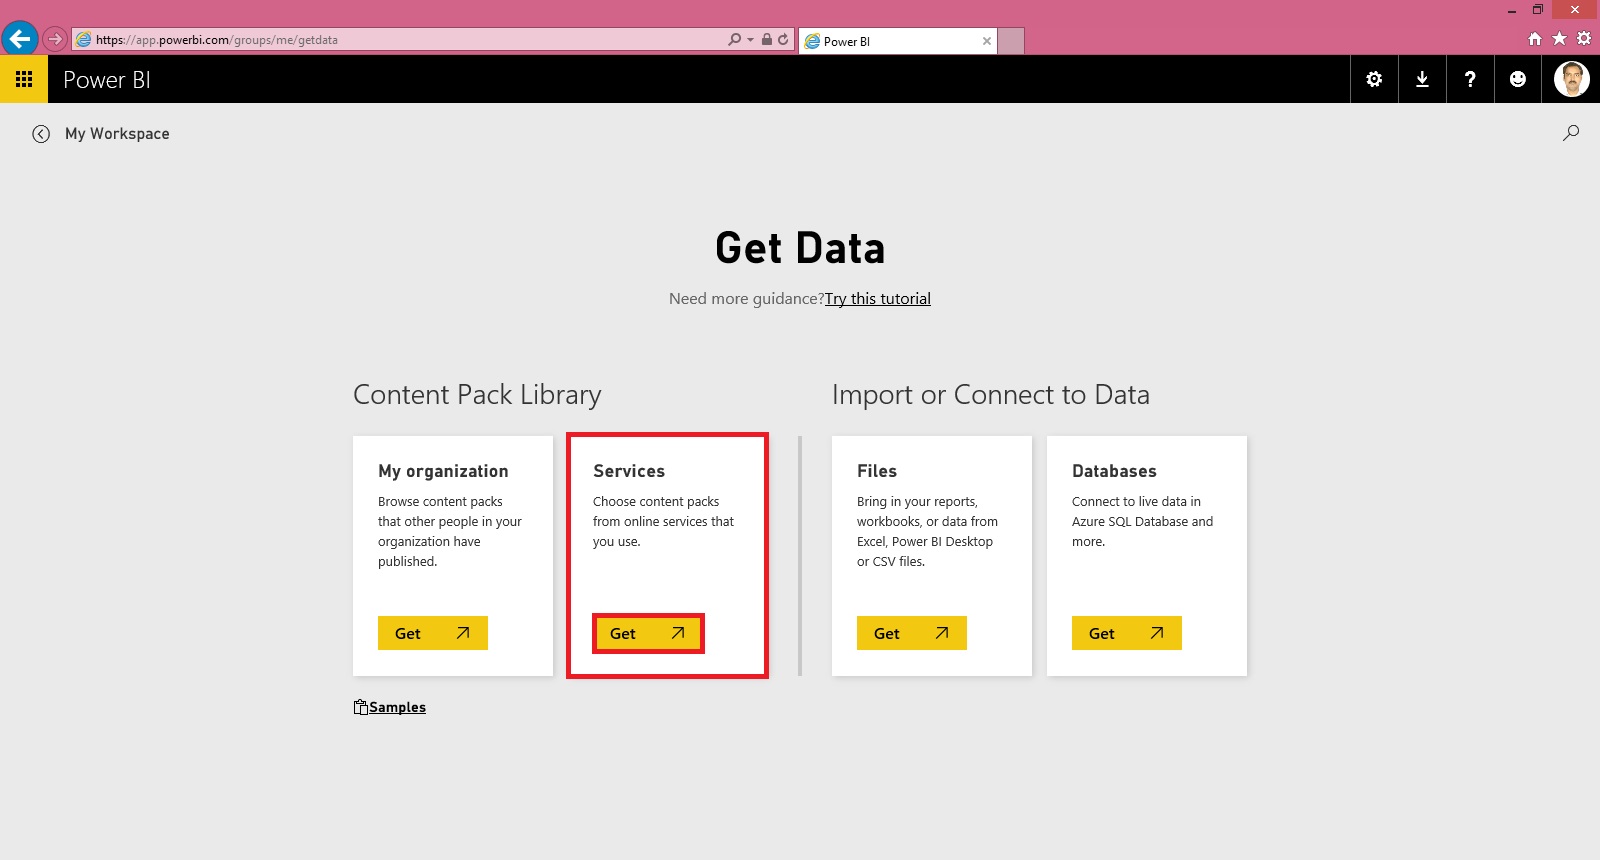
Login to Power BI using your credentials.
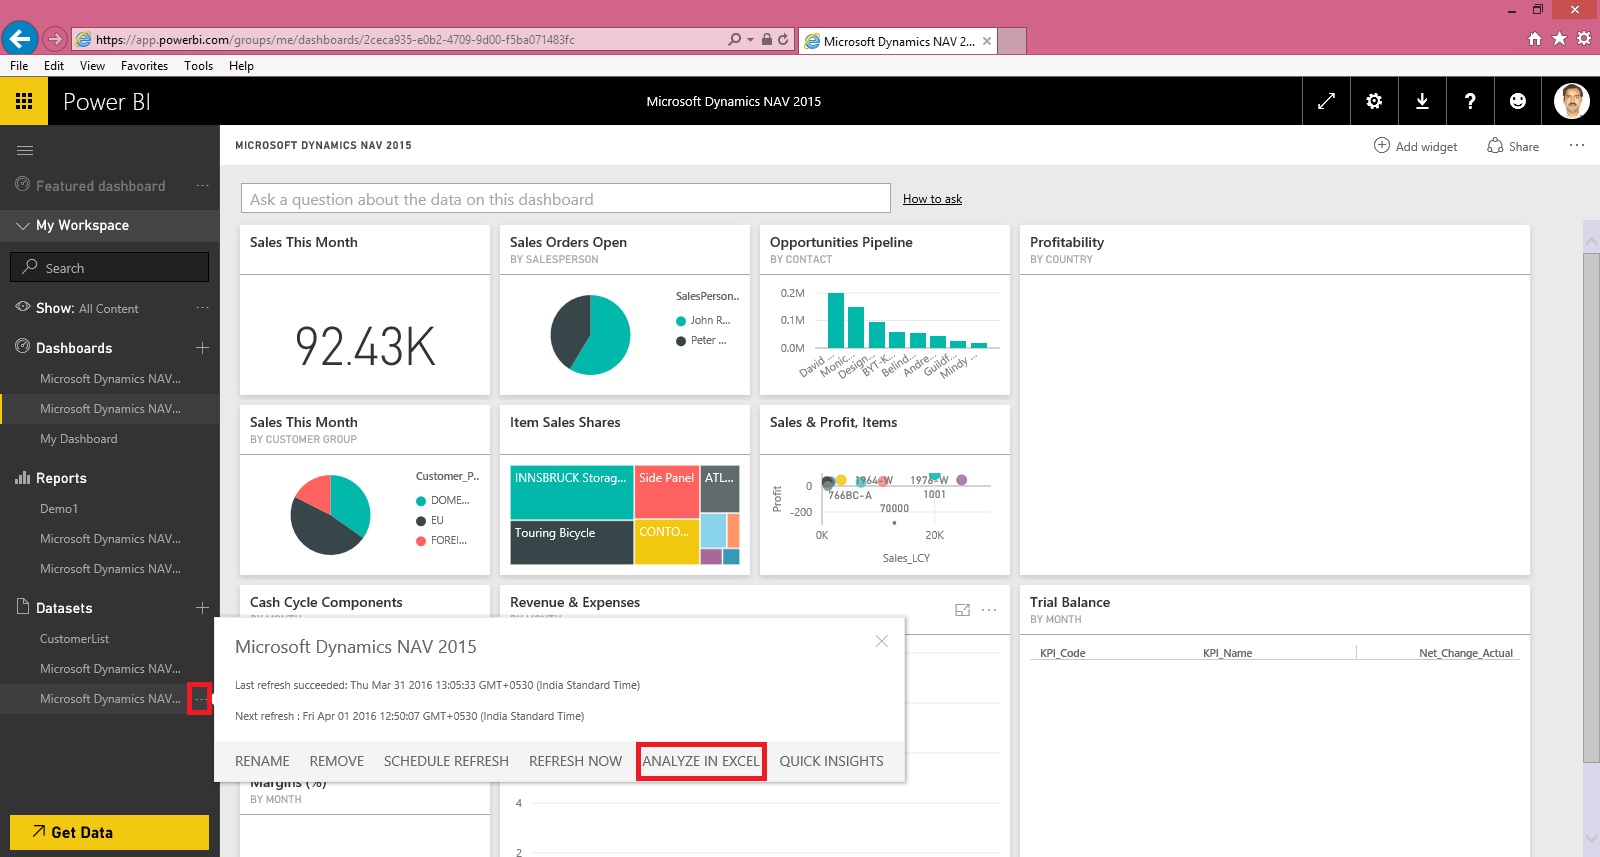
Select the Dataset which you wish to analyse, click the three dots on right and from appearing menu choose ANALYZE IN EXCEL.
You will be prompted for Analyse in Excel (preview). If you are running first time please install it.
At the same time you will be prompted for (.odc) MS Office Data Connection file to save/open.
Save and then open the File in Excel.

On opening the file you will be prompted for security concern Enable to allow it.

You will be able to see Pivot Table Fields, containing all of the Tables available in the Dataset.

Now you can play with your data to analyse and create Pivot, Charts and share with others or you can Pin back your result to Power BI Dashboards using concept we used in our previous post.
That’s all for today, I will come up with more features in my future posts.
Till then keep practicing & Learning.
In case you have missed my previous posts here I present the link to all previous posts below.
Microsoft Power BI – Part – I
Introduction to Power BI and Creating Report from Excel Data, Local Files.
Microsoft Power BI – Part – II
Introduction to few Features of Power BI
Microsoft Power BI – Part – III
Power BI Desktop, Creating Dataset & Reports from In Premise Database installation
Microsoft Power BI – Part – IV
Power BI Gateway usage
Microsoft Power BI – Part – V
Scheduling Refresh of Dataset & Report created using In Premise Database
Microsoft Power BI – Part – VI
Power BI Content Pack
Microsoft Power BI – Part – VII
Power BI Mobile App
Microsoft Power BI – Part – VIII
Power BI Content Pack
Microsoft Power BI – Part – IX
Power BI Publisher for Excel
Login to Power BI using your credentials.
Select the Dataset which you wish to analyse, click the three dots on right and from appearing menu choose ANALYZE IN EXCEL.
You will be prompted for Analyse in Excel (preview). If you are running first time please install it.
At the same time you will be prompted for (.odc) MS Office Data Connection file to save/open.
Save and then open the File in Excel.
On opening the file you will be prompted for security concern Enable to allow it.
You will be able to see Pivot Table Fields, containing all of the Tables available in the Dataset.
Now you can play with your data to analyse and create Pivot, Charts and share with others or you can Pin back your result to Power BI Dashboards using concept we used in our previous post.
That’s all for today, I will come up with more features in my future posts.
Till then keep practicing & Learning.
Wednesday, 30 March 2016
Microsoft Power BI – Part IX
Continuing from my previous post. Today we will see usage of Power BI Publisher for Excel.
In case you have missed my previous posts here I present the link to all previous posts below.
Microsoft Power BI – Part – I
Introduction to Power BI and Creating Report from Excel Data, Local Files.
Microsoft Power BI – Part – II
Introduction to few Features of Power BI
Microsoft Power BI – Part – III
Power BI Desktop, Creating Dataset & Reports from In Premise Database installation
Microsoft Power BI – Part – IV
Power BI Gateway usage
Microsoft Power BI – Part – V
Scheduling Refresh of Dataset & Report created using In Premise Database
Microsoft Power BI – Part – VI
Power BI Content Pack
Microsoft Power BI – Part – VII
Power BI Mobile App
Microsoft Power BI – Part – VIII
Power BI Content Pack
Sharing key Excel insights just got easier. Save snapshots of important PivotTables, Charts, cell ranges, and more from across all of your spreadsheets to a single location quickly with the Power BI publisher for Excel. Simply highlight the elements you want to save, then click the "Pin to" button: now you’ve got a powerful web dashboard that you can share with everyone in your organization.
Let us see how we can use this feature.
Login to Power BI with your credentials.

From Download Menu Section choose Power BI Publisher for Excel.
Or visit Link: https://powerbi.microsoft.com/en-us/excel-dashboard-publisher/

Select your desired Excel Version 32 or 64 bit as installed on your PC and download the Package.
Close your Excel and Install the Package and follow on screen guide.
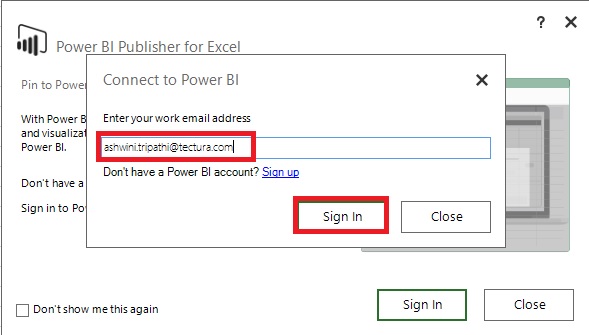
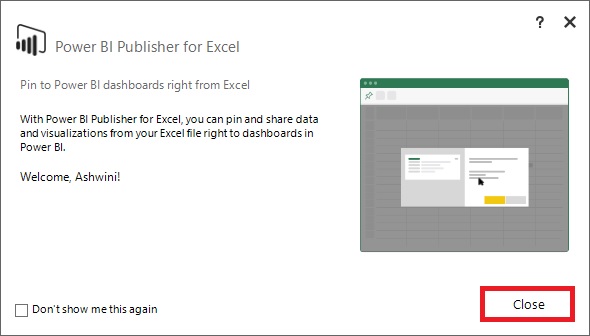
After Installation when you open your Excel First time after Installing the Package. You will get similar to below screen.

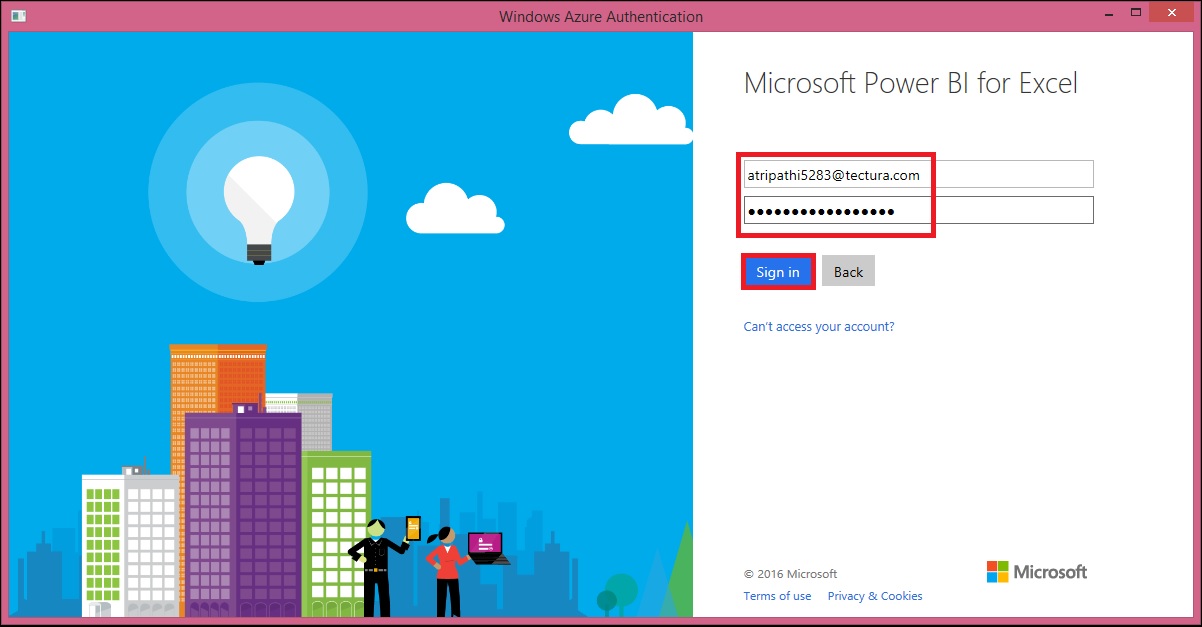
Sign in with your Power BI Credentials.
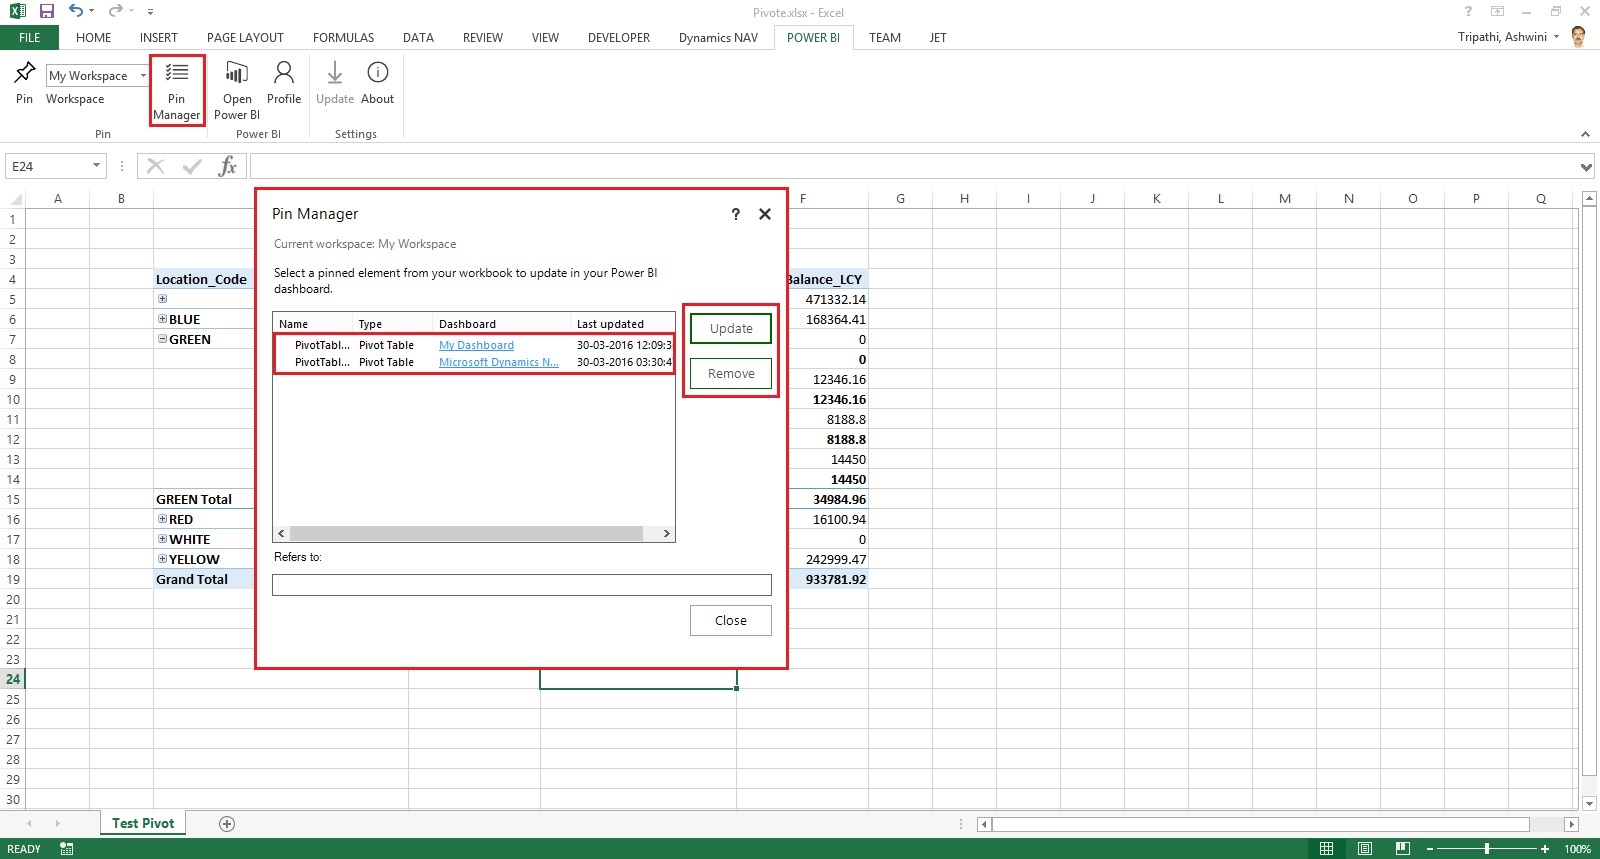
I have created a Pivot in excel as below which I want to share on my Desktop.
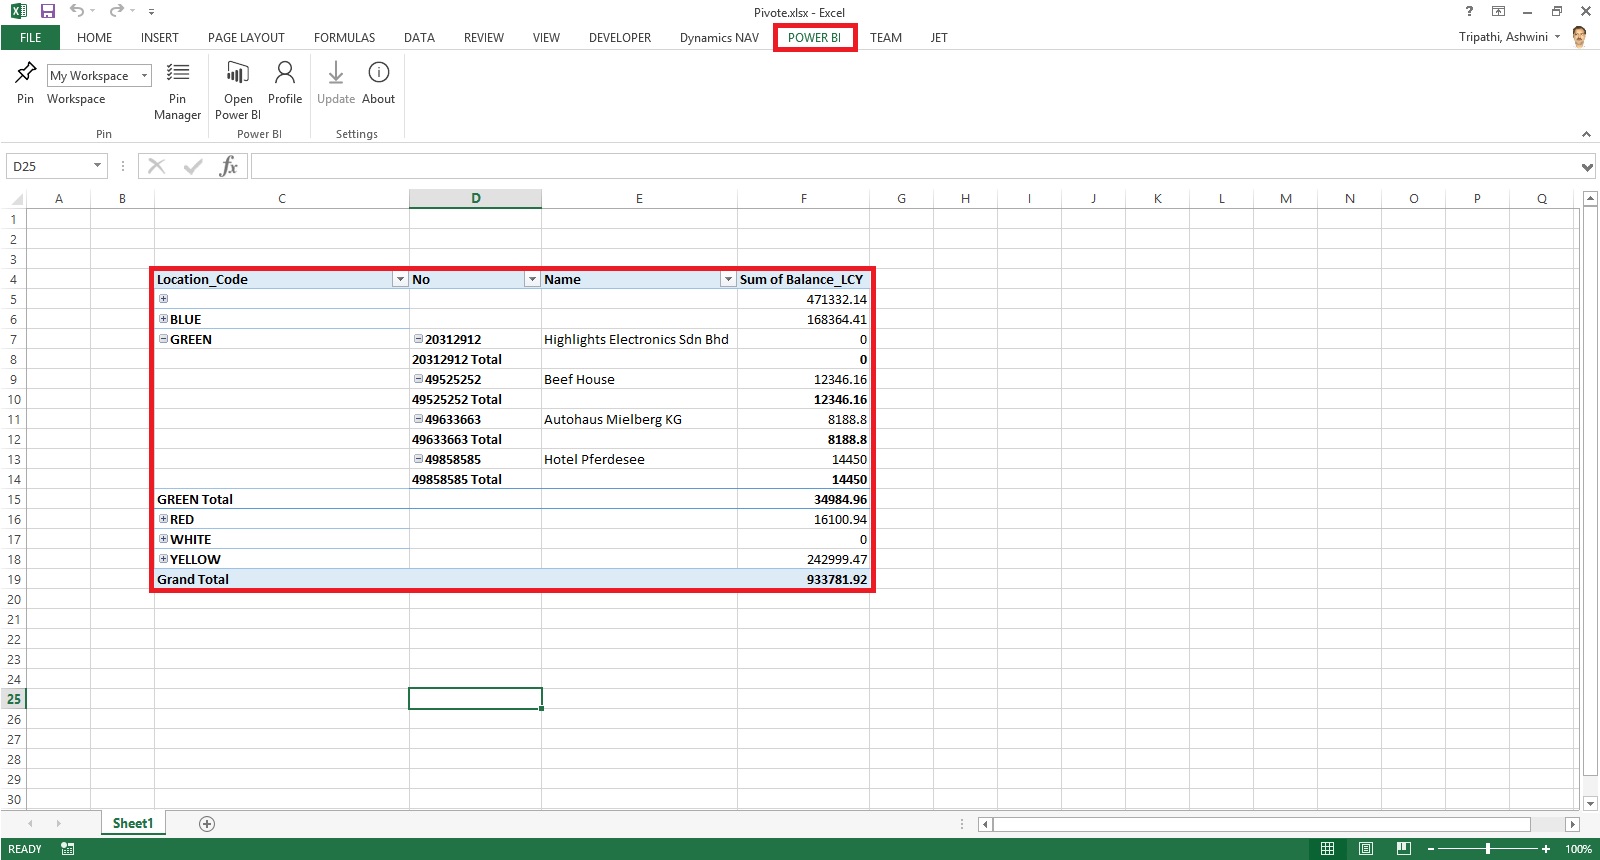
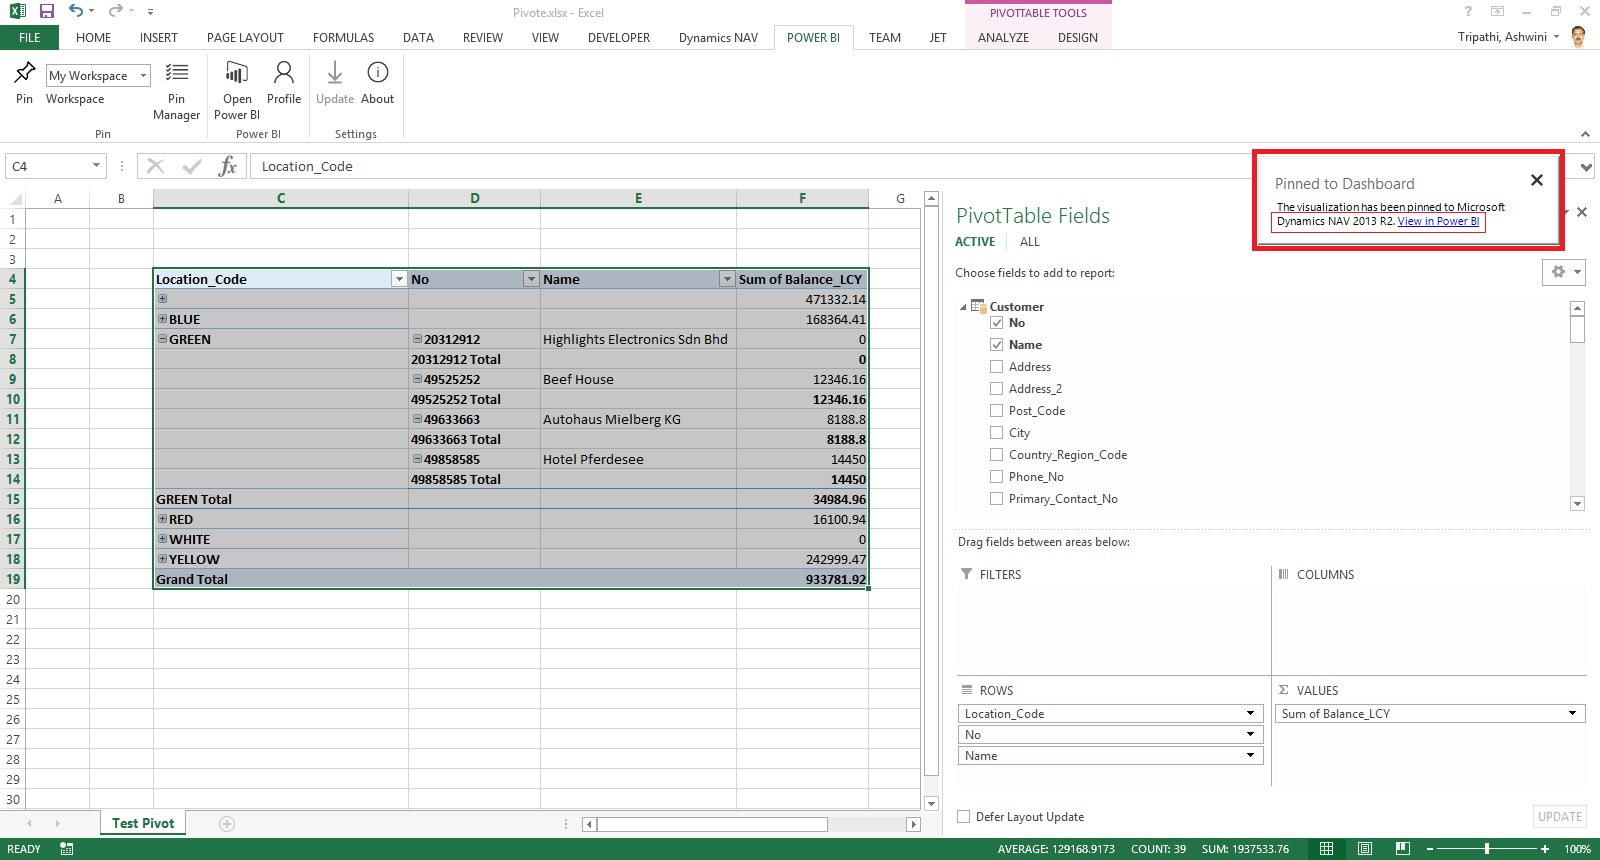
Select the Region/Range that you wish to publish from Power BI choose Pin, as shown below.

In my case I have already pined so confirmation Dialog Box is taken else it will Pin the Selected Range as a snapshot on selected Workspace.

Make sure you select right Workspace before you Pin.

After Publishing you will get confirmation as below.
Using the Link, Login with your credentials to the Power BI and switch to the Dashboard on which you published.
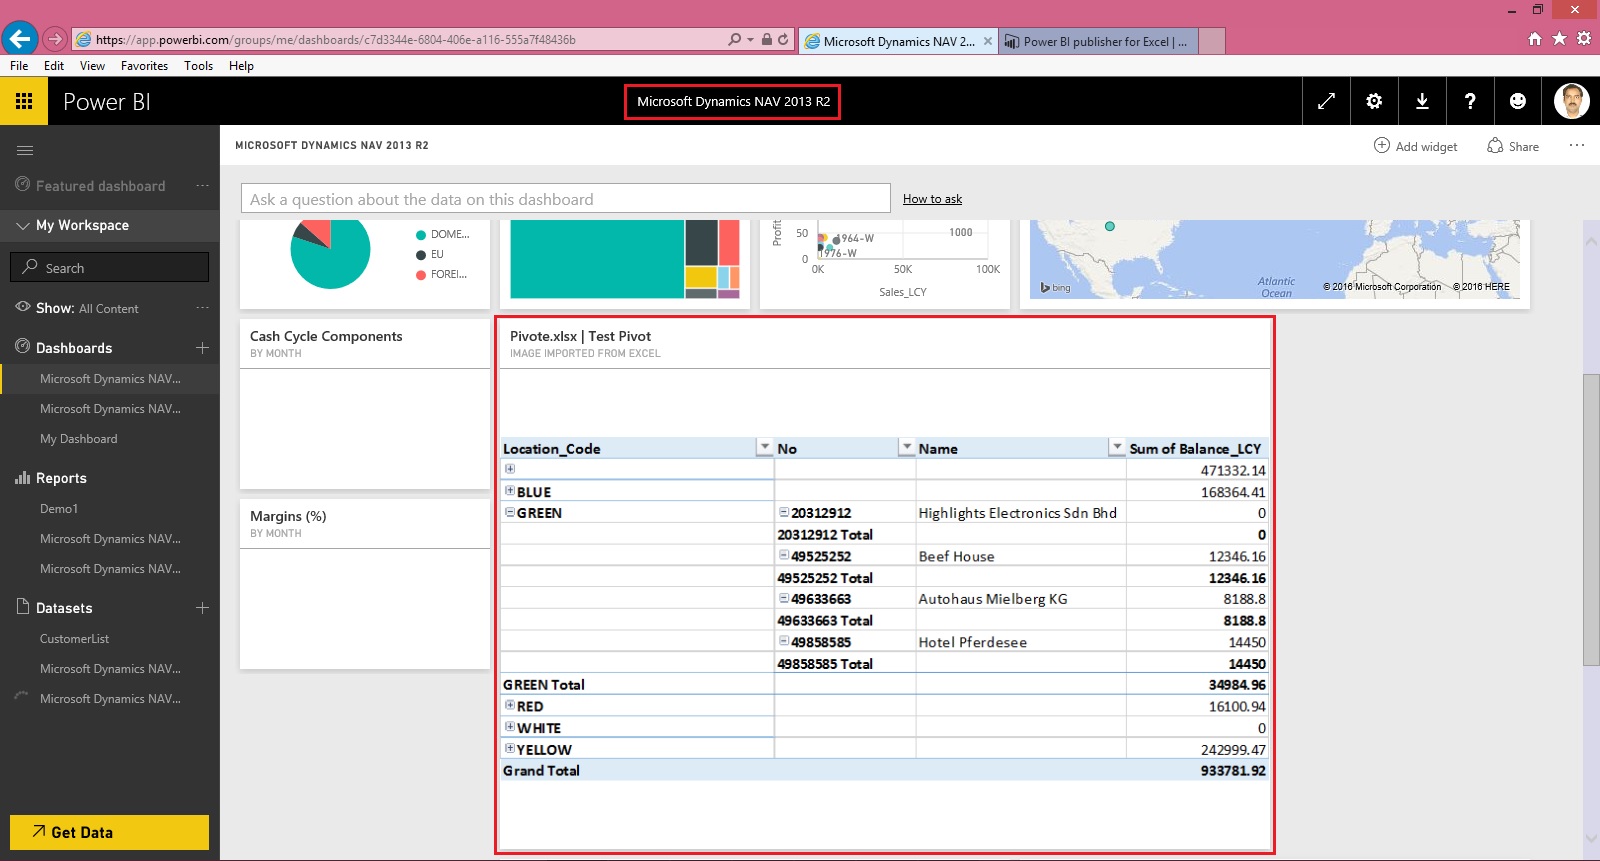
This way you can Pin Snapshot of PivotTables, Charts, cell ranges, and more. You can update existing with new one and manage all your Pins.
Save your Excel and Exit.

Try useful feature.
I will come up with more details in my future posts.
Till then keep practicing and learning using online Blogs, help and documents.
In case you have missed my previous posts here I present the link to all previous posts below.
Microsoft Power BI – Part – I
Introduction to Power BI and Creating Report from Excel Data, Local Files.
Microsoft Power BI – Part – II
Introduction to few Features of Power BI
Microsoft Power BI – Part – III
Power BI Desktop, Creating Dataset & Reports from In Premise Database installation
Microsoft Power BI – Part – IV
Power BI Gateway usage
Microsoft Power BI – Part – V
Scheduling Refresh of Dataset & Report created using In Premise Database
Microsoft Power BI – Part – VI
Power BI Content Pack
Microsoft Power BI – Part – VII
Power BI Mobile App
Microsoft Power BI – Part – VIII
Power BI Content Pack
Sharing key Excel insights just got easier. Save snapshots of important PivotTables, Charts, cell ranges, and more from across all of your spreadsheets to a single location quickly with the Power BI publisher for Excel. Simply highlight the elements you want to save, then click the "Pin to" button: now you’ve got a powerful web dashboard that you can share with everyone in your organization.
Let us see how we can use this feature.
Login to Power BI with your credentials.
From Download Menu Section choose Power BI Publisher for Excel.
Or visit Link: https://powerbi.microsoft.com/en-us/excel-dashboard-publisher/
Select your desired Excel Version 32 or 64 bit as installed on your PC and download the Package.
Close your Excel and Install the Package and follow on screen guide.
After Installation when you open your Excel First time after Installing the Package. You will get similar to below screen.
Sign in with your Power BI Credentials.
I have created a Pivot in excel as below which I want to share on my Desktop.
Select the Region/Range that you wish to publish from Power BI choose Pin, as shown below.
In my case I have already pined so confirmation Dialog Box is taken else it will Pin the Selected Range as a snapshot on selected Workspace.
Make sure you select right Workspace before you Pin.
After Publishing you will get confirmation as below.
Using the Link, Login with your credentials to the Power BI and switch to the Dashboard on which you published.
This way you can Pin Snapshot of PivotTables, Charts, cell ranges, and more. You can update existing with new one and manage all your Pins.
Save your Excel and Exit.
Try useful feature.
I will come up with more details in my future posts.
Till then keep practicing and learning using online Blogs, help and documents.
Leveraging Business Intelligence for Ad Hoc Analysis
Leveraging Business Intelligence for Ad Hoc Analysis
Video-1
http://jetreports.wistia.com/medias/gmcjlekmpv?embedType=iframe&seo=false&videoWidth=640
Video-2
http://jetreports.wistia.com/medias/rkzi1ronom?embedType=iframe&seo=false&videoWidth=640
Video-1
http://jetreports.wistia.com/medias/gmcjlekmpv?embedType=iframe&seo=false&videoWidth=640
Video-2
http://jetreports.wistia.com/medias/rkzi1ronom?embedType=iframe&seo=false&videoWidth=640
Tuesday, 29 March 2016
Microsoft Power BI – Part VIII
Continuing from my previous post. Today we will see usage of Power Content Pack to Refresh in Premise Navision Installation using Personnel Gateway.
Please see my previous post it will help you in continuing with this Walkthrough.
In case you have missed here I present the link to all previous posts here below.
Microsoft Power BI – Part – I
Introduction to Power BI and Creating Report from Excel Data, Local Files.
Microsoft Power BI – Part – II
Introduction to few Features of Power BI
Microsoft Power BI – Part – III
Power BI Desktop, Creating Dataset & Reports from In Premise Database installation
Microsoft Power BI – Part – IV
Power BI Gateway usage
Microsoft Power BI – Part – V
Scheduling Refresh of Dataset & Report created using In Premise Database
Microsoft Power BI – Part – VI
Power BI Content Pack
Microsoft Power BI – Part – VII
Power BI Mobile App
Step -1
Check your Service is up & running, here we are not going to use SLL in fact Personnel Gateway.
Step -2
Make sure you Imported your Query Objects required for Power BI Dynamics Nav Content Pack. If you are not using NAV-2016, in my case I am using NAV-2015 for this Walkthrough.
Step -3
Make sure your Web Services are published.
Step -4
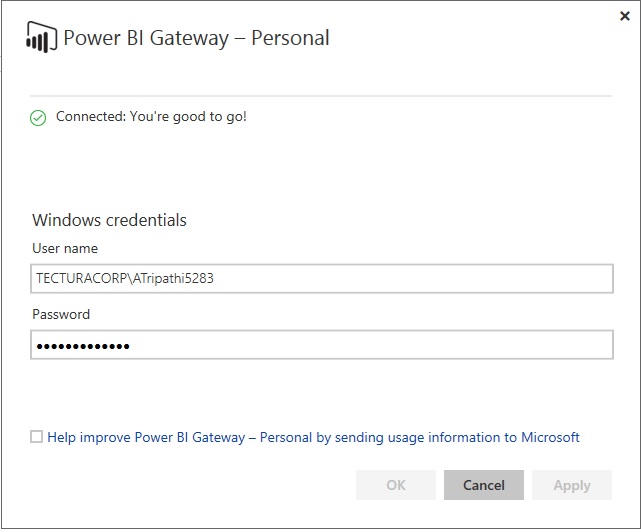
You have installed the Power BI Gateway – Personal and Login to it using your Credentials.
Step – 5
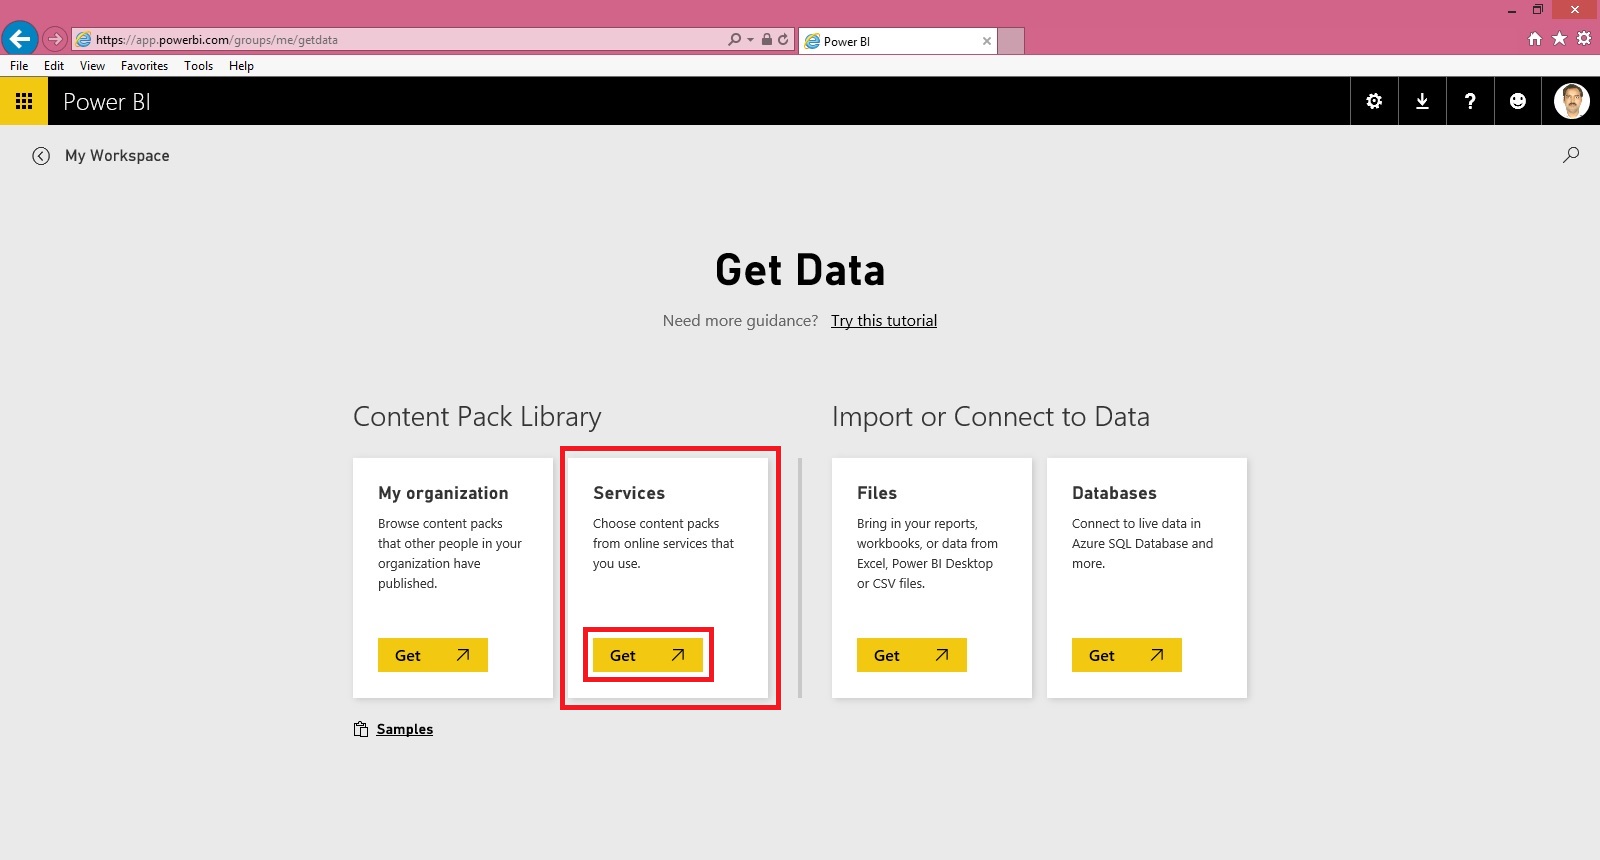
Login to PowerBI using your Credentials and choose Get Data from Bottom Left Corner in your Navigation Bar.
Step – 6
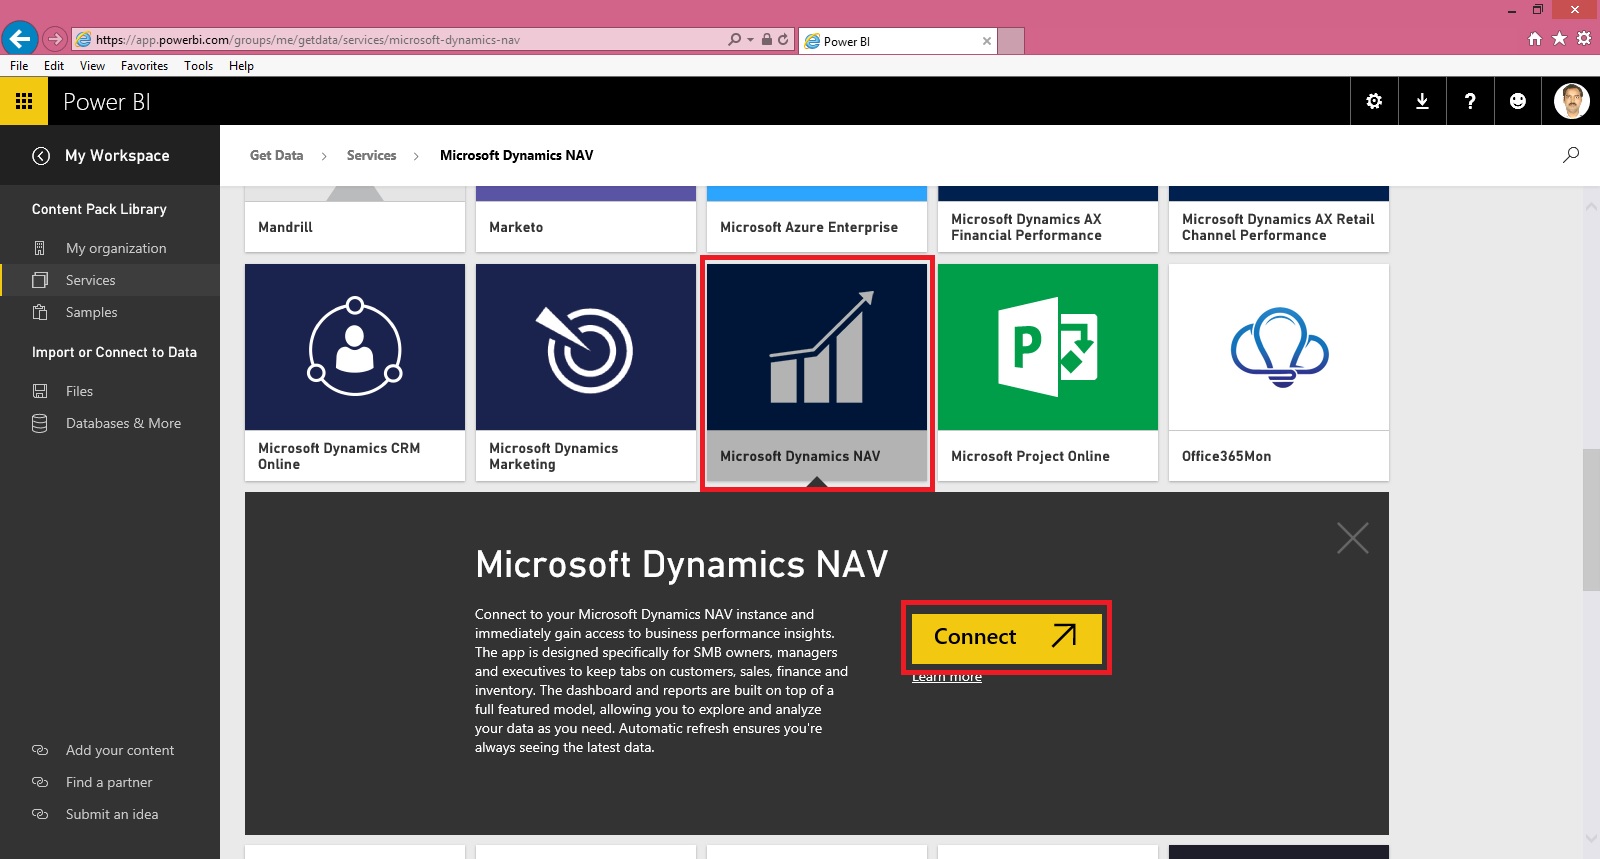
Connect Your Service using MS Dynamics Content Pack.
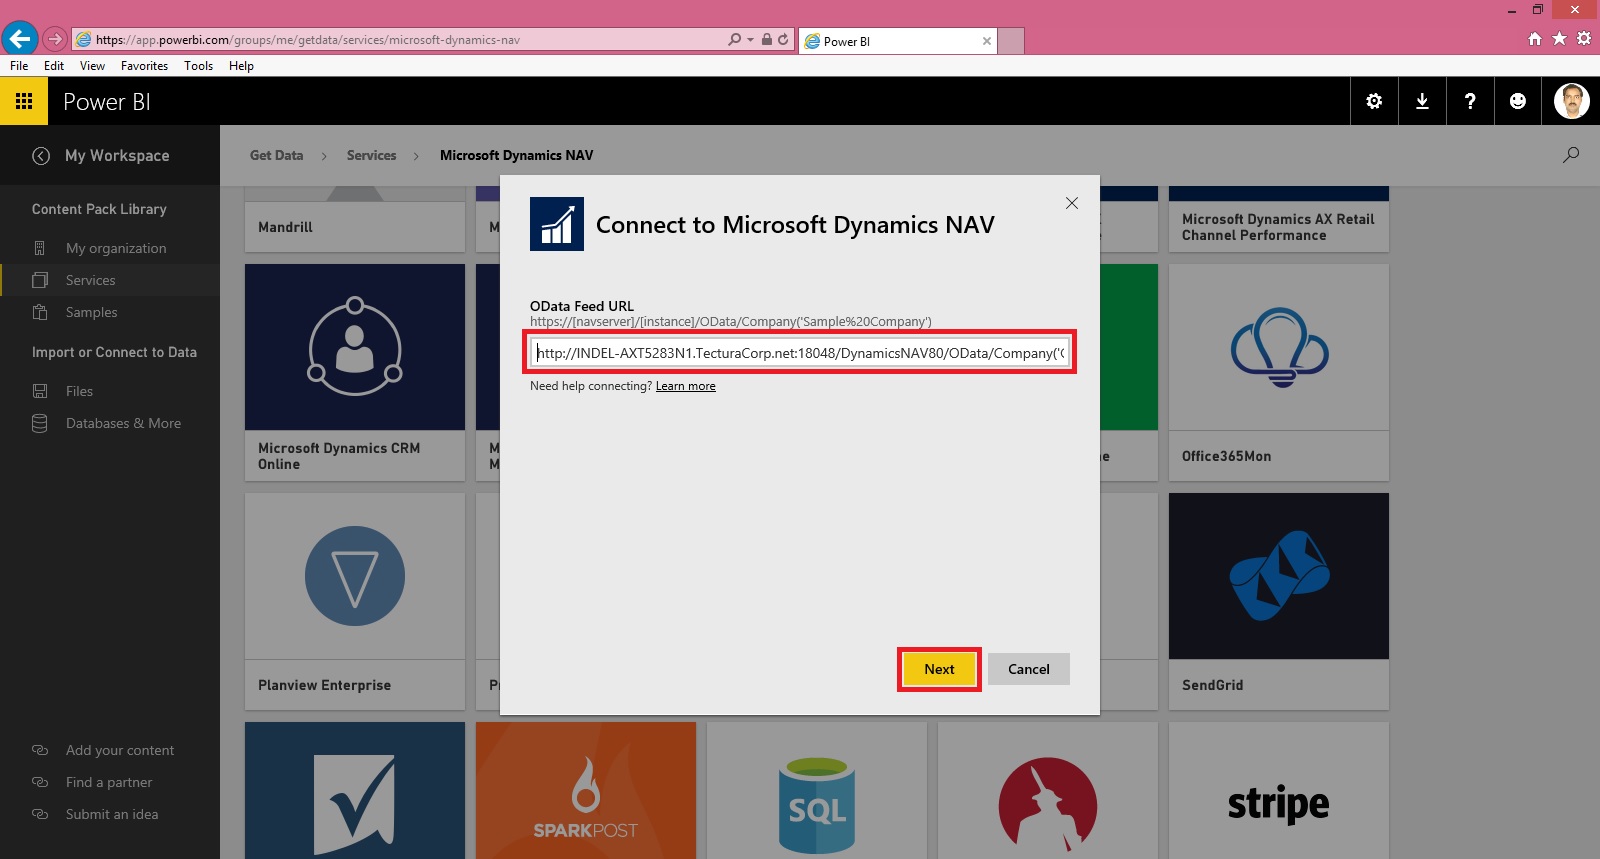
Notice here I am not using https:// also remove any ‘/’ and Service name from the URL.
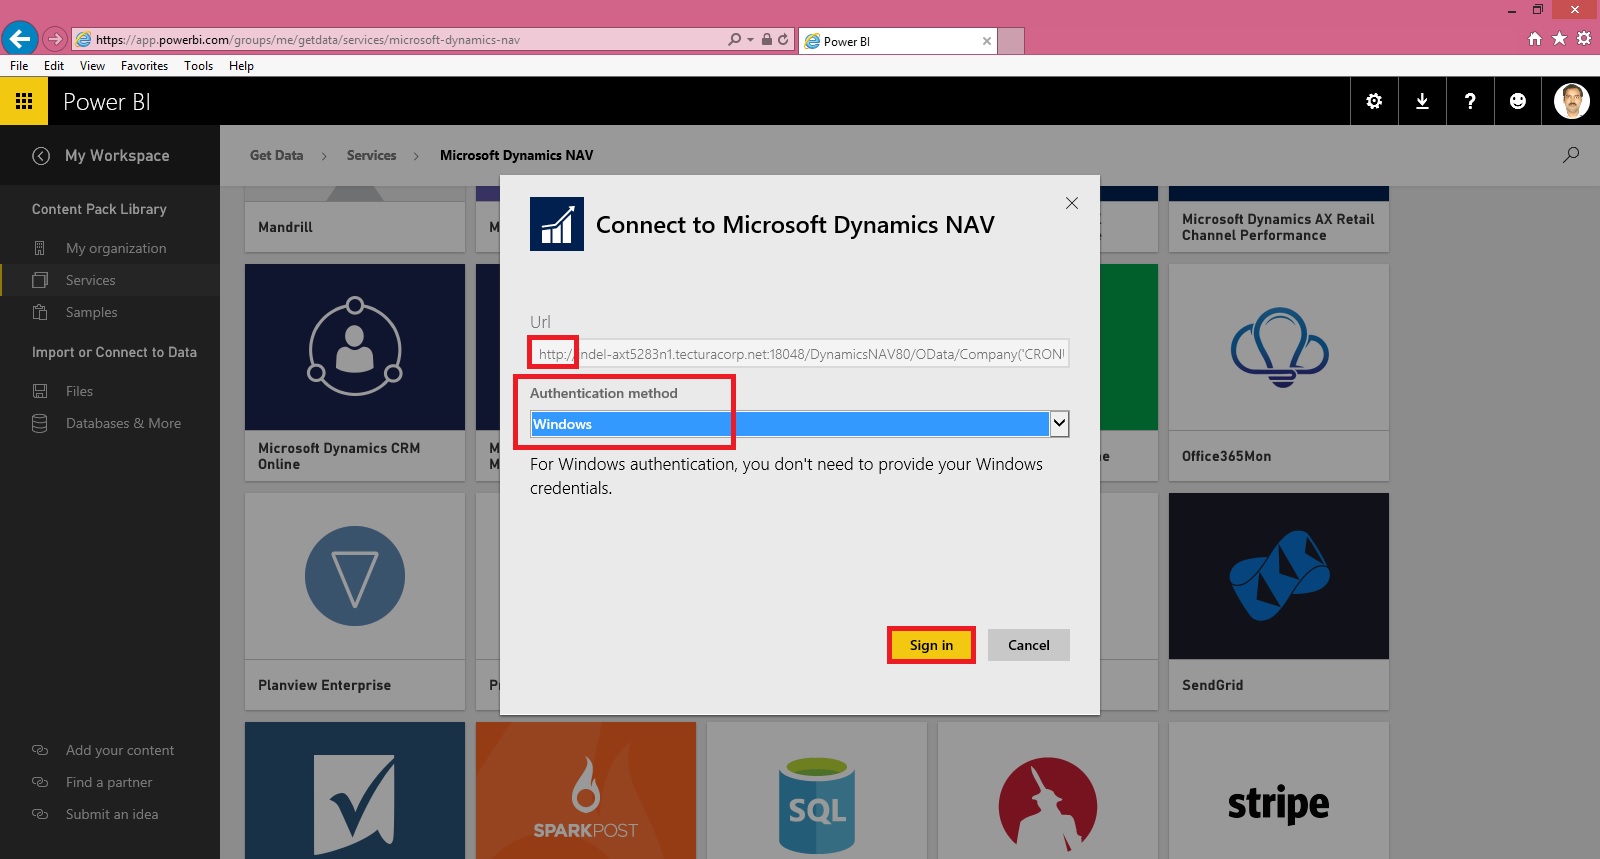
Set your Authentication Mode and Sign In.
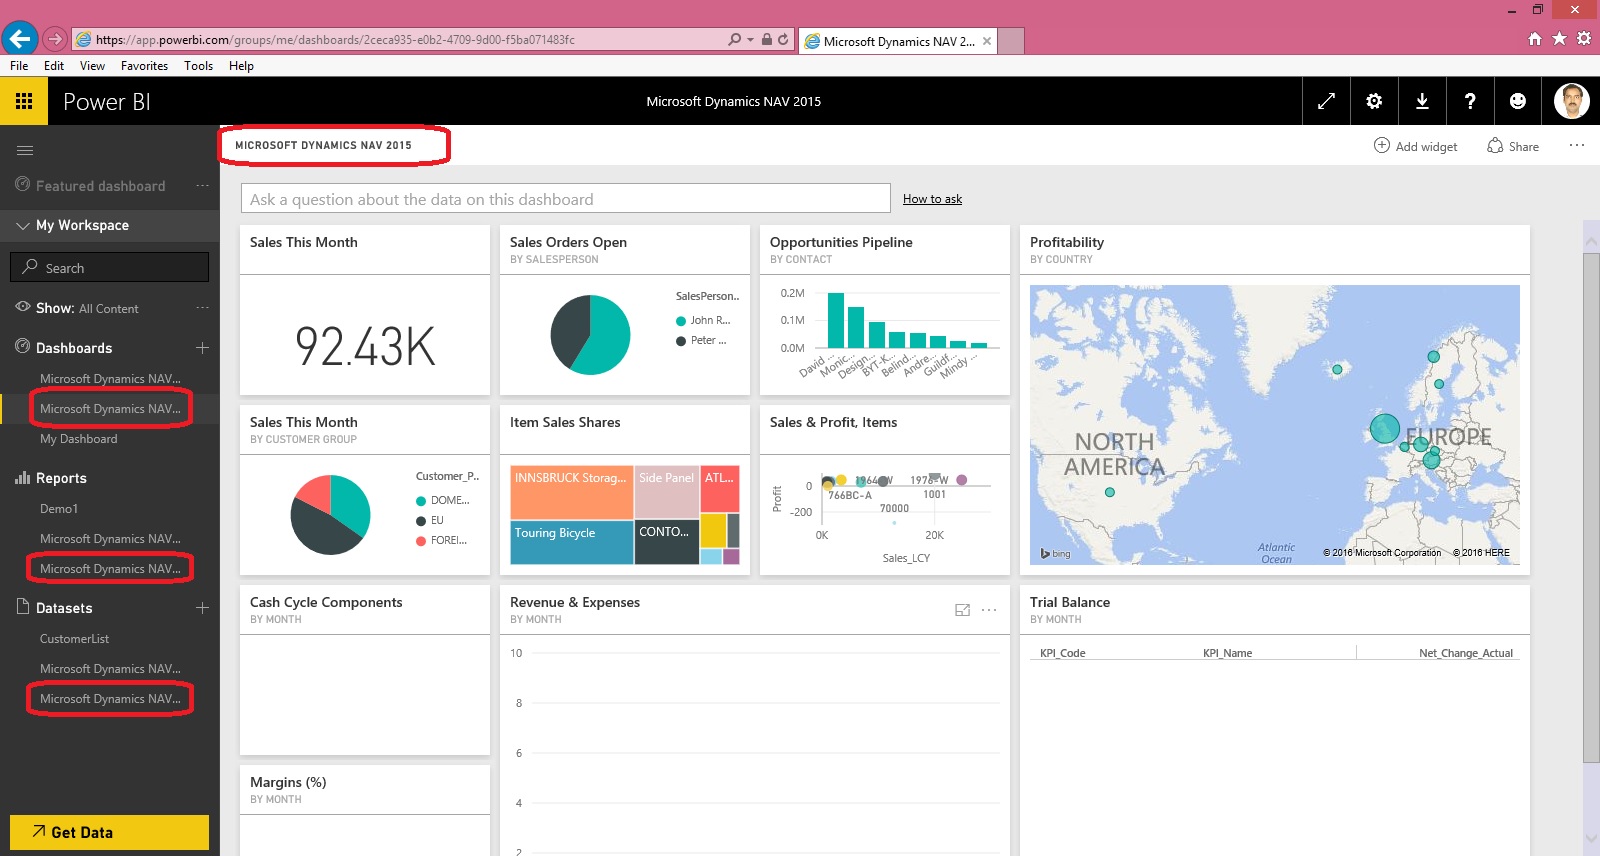
It will take some moment and your Dataset, Report & Dashboard will be available to you.
Graphical representation and data may vary depending upon data in your database.
We are done.
For further detail on any step you can refer previous posts for any clarifications, Links provided above.
Will come up with more details in my upcoming posts.
Till then keep trying and practicing.
Please see my previous post it will help you in continuing with this Walkthrough.
In case you have missed here I present the link to all previous posts here below.
Microsoft Power BI – Part – I
Introduction to Power BI and Creating Report from Excel Data, Local Files.
Microsoft Power BI – Part – II
Introduction to few Features of Power BI
Microsoft Power BI – Part – III
Power BI Desktop, Creating Dataset & Reports from In Premise Database installation
Microsoft Power BI – Part – IV
Power BI Gateway usage
Microsoft Power BI – Part – V
Scheduling Refresh of Dataset & Report created using In Premise Database
Microsoft Power BI – Part – VI
Power BI Content Pack
Microsoft Power BI – Part – VII
Power BI Mobile App
Step -1
Check your Service is up & running, here we are not going to use SLL in fact Personnel Gateway.
Step -2
Make sure you Imported your Query Objects required for Power BI Dynamics Nav Content Pack. If you are not using NAV-2016, in my case I am using NAV-2015 for this Walkthrough.
Step -3
Make sure your Web Services are published.
Step -4
You have installed the Power BI Gateway – Personal and Login to it using your Credentials.
Step – 5
Login to PowerBI using your Credentials and choose Get Data from Bottom Left Corner in your Navigation Bar.
Step – 6
Connect Your Service using MS Dynamics Content Pack.
Notice here I am not using https:// also remove any ‘/’ and Service name from the URL.
Set your Authentication Mode and Sign In.
It will take some moment and your Dataset, Report & Dashboard will be available to you.
Graphical representation and data may vary depending upon data in your database.
We are done.
For further detail on any step you can refer previous posts for any clarifications, Links provided above.
Will come up with more details in my upcoming posts.
Till then keep trying and practicing.
Friday, 25 March 2016
BI Advantage (“Reporting” and “Cubes”) Jet Reports
“Reporting” and “Cubes”: The Best of Both Worlds
Video-1
http://jetreports.wistia.com/medias/ai8jnon1nf?embedType=iframe&seo=false&videoWidth=640
Video-2
http://jetreports.wistia.com/medias/0w88iu3tg2?embedType=iframe&seo=false&videoWidth=640
Video-1
http://jetreports.wistia.com/medias/ai8jnon1nf?embedType=iframe&seo=false&videoWidth=640
Video-2
http://jetreports.wistia.com/medias/0w88iu3tg2?embedType=iframe&seo=false&videoWidth=640
BI Advantage (Account Schedules in NAV) Jet Reports
Using BI to Get the Most out of Account Schedules in NAV
Video-1
http://jetreports.wistia.com/medias/ggbxryzper?embedType=iframe&seo=false&videoWidth=640
Video-2
http://jetreports.wistia.com/medias/530rukjk1p?embedType=iframe&seo=false&videoWidth=640
Video-1
http://jetreports.wistia.com/medias/ggbxryzper?embedType=iframe&seo=false&videoWidth=640
Video-2
http://jetreports.wistia.com/medias/530rukjk1p?embedType=iframe&seo=false&videoWidth=640
BI Advantage (Reporting to Business Intelligence) Jet Reports
Graduating from Reporting to Business Intelligence
Video-1
http://jetreports.wistia.com/medias/rh3i0aunwm?embedType=iframe&seo=false&videoWidth=640
Video-2
http://jetreports.wistia.com/medias/b9xq4oj335?embedType=iframe&seo=false&videoWidth=640
Video-1
http://jetreports.wistia.com/medias/rh3i0aunwm?embedType=iframe&seo=false&videoWidth=640
Video-2
http://jetreports.wistia.com/medias/b9xq4oj335?embedType=iframe&seo=false&videoWidth=640
BI Advantage (Web Based Dashboards ) Jet Reports
Web Based Dashboards Provide Insight from Anywhere
Video-1
http://jetreports.wistia.com/medias/9uesa3dfes?embedType=iframe&seo=false&videoWidth=640
Video-2
http://jetreports.wistia.com/medias/dbeyjnvo8t?embedType=iframe&seo=false&videoWidth=640
Video-1
http://jetreports.wistia.com/medias/9uesa3dfes?embedType=iframe&seo=false&videoWidth=640
Video-2
http://jetreports.wistia.com/medias/dbeyjnvo8t?embedType=iframe&seo=false&videoWidth=640
BI Advantage (The 5 Minute Dashboard ) Jet Reports
The 5 Minute Dashboard - It's Easier than You Think
Video-1
http://jetreports.wistia.com/medias/c9vnu6qmpb?embedType=iframe&seo=false&videoWidth=640
Video-2
http://jetreports.wistia.com/medias/pit9fq9wx0?embedType=iframe&seo=false&videoWidth=640
Video-1
http://jetreports.wistia.com/medias/c9vnu6qmpb?embedType=iframe&seo=false&videoWidth=640
Video-2
http://jetreports.wistia.com/medias/pit9fq9wx0?embedType=iframe&seo=false&videoWidth=640
Wednesday, 23 March 2016
Microsoft Power BI for Beginners Table of Content
In March I have written few posts on Power BI keeping in mind who are beginners.
In case you have missed here I present the link to all those posts here below.
Microsoft Power BI – Part – I
Introduction to Power BI and Creating Report from Excel Data, Local Files.
Microsoft Power BI – Part – II
Introduction to few Features of Power BI
Microsoft Power BI – Part – III
Power BI Desktop, Creating Dataset & Reports from In Premise Database installation
Microsoft Power BI – Part – IV
Power BI Gateway usage
Microsoft Power BI – Part – V
Scheduling Refresh of Dataset & Report created using In Premise Database
Microsoft Power BI – Part – VI
Power BI Microsoft NAV Content Pack
Microsoft Power BI – Part – VII
Power BI Mobile App
Microsoft Power BI – Part – VIII
Power BI Content Pack
Microsoft Power BI – Part – IX
Power BI Publisher for Excel
Microsoft Power BI – Part – X
ANALYZE IN EXCEL
I will come up with more features and other important details in my future posts.
You can find lots of materials on Power BI here : https://powerbi.microsoft.com/en-us/
https://powerbi.microsoft.com/en-us/learning/
Microsoft Power BI – Part – VII
Continuing from my previous post, if you have not seen yet please check it out it will help you continuing with this post.
You can check:
Microsoft Power BI – Part – I
Microsoft Power BI – Part – II
Microsoft Power BI – Part – III
Microsoft Power BI – Part – IV
Microsoft Power BI – Part – V
Microsoft Power BI – Part – VI
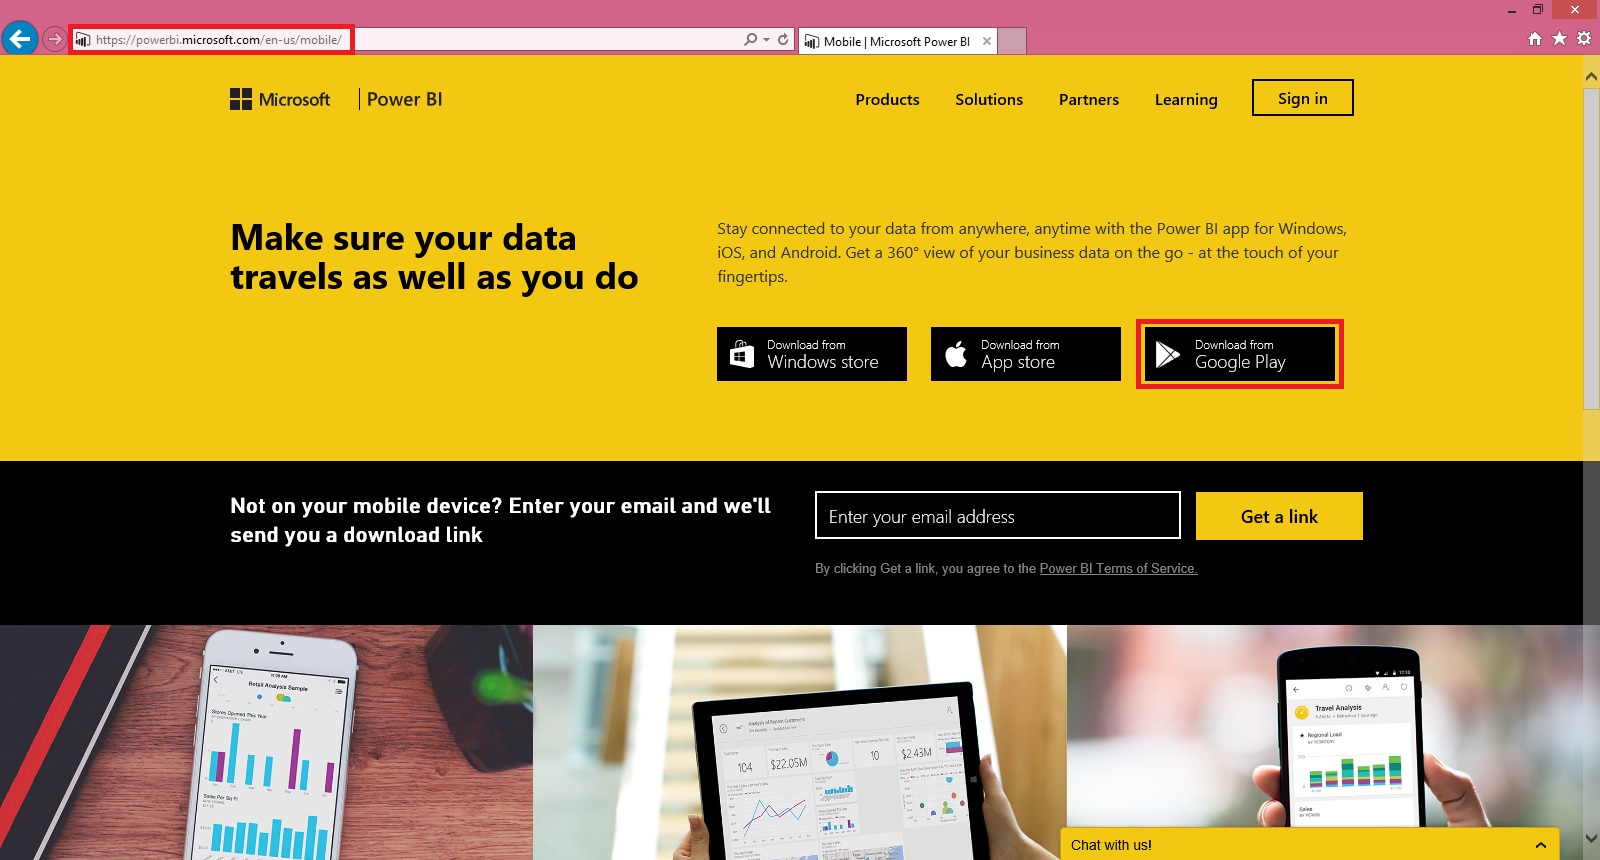
Open the powerbi.com and go to download link of mobile app : https://powerbi.microsoft.com/en-us/mobile/
I have Android so I am selecting Google Play, you select appropriate link as per your mobile OS.
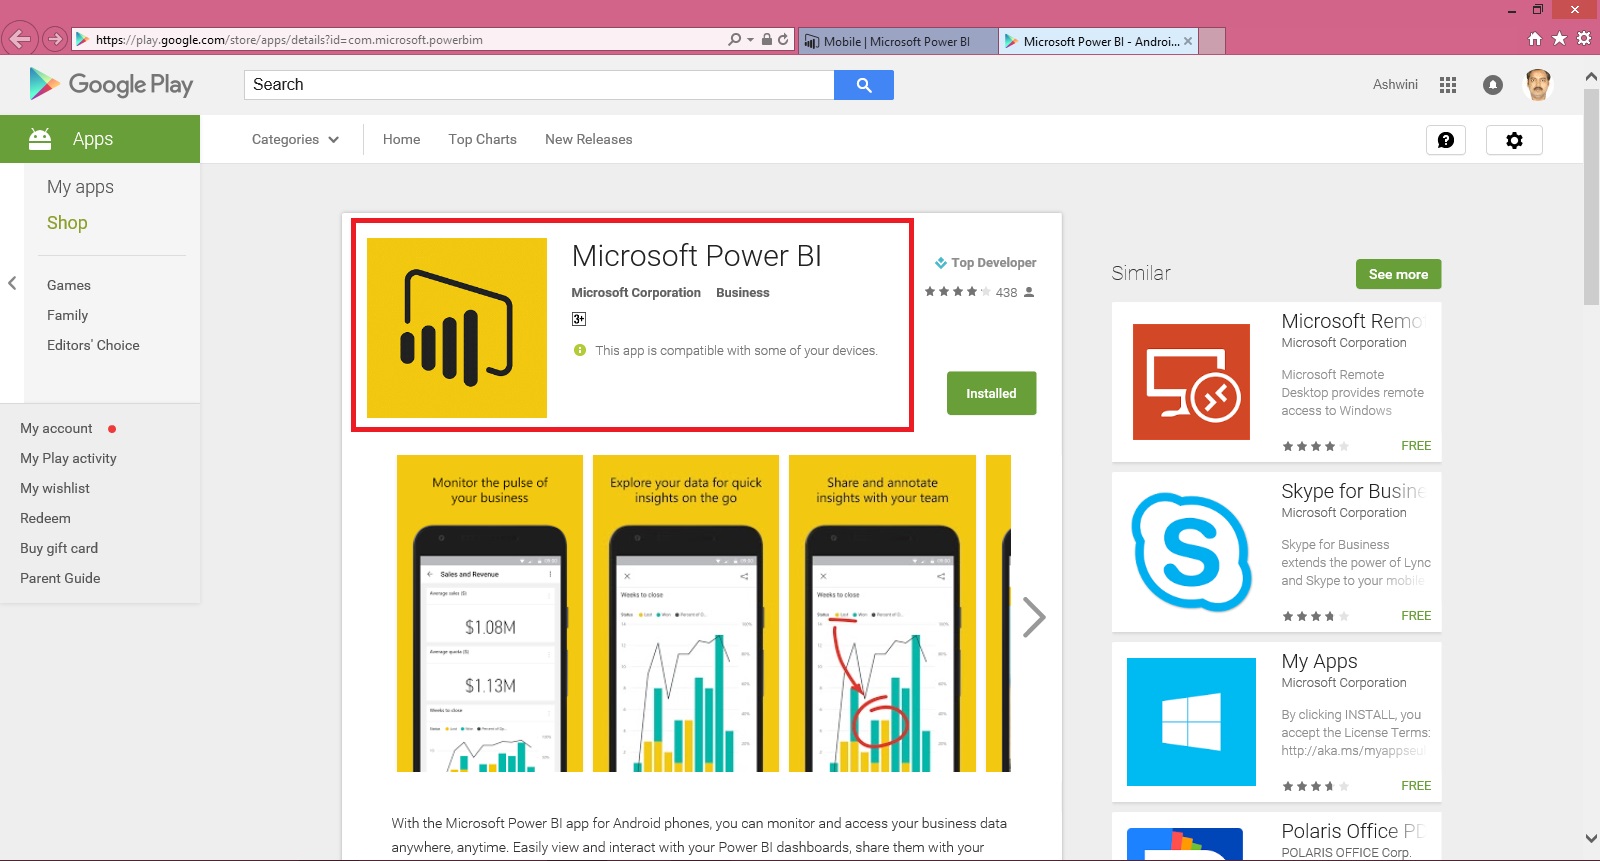
Login with your Google account and choose Install.
Alternatively you can install from your mobile browser.
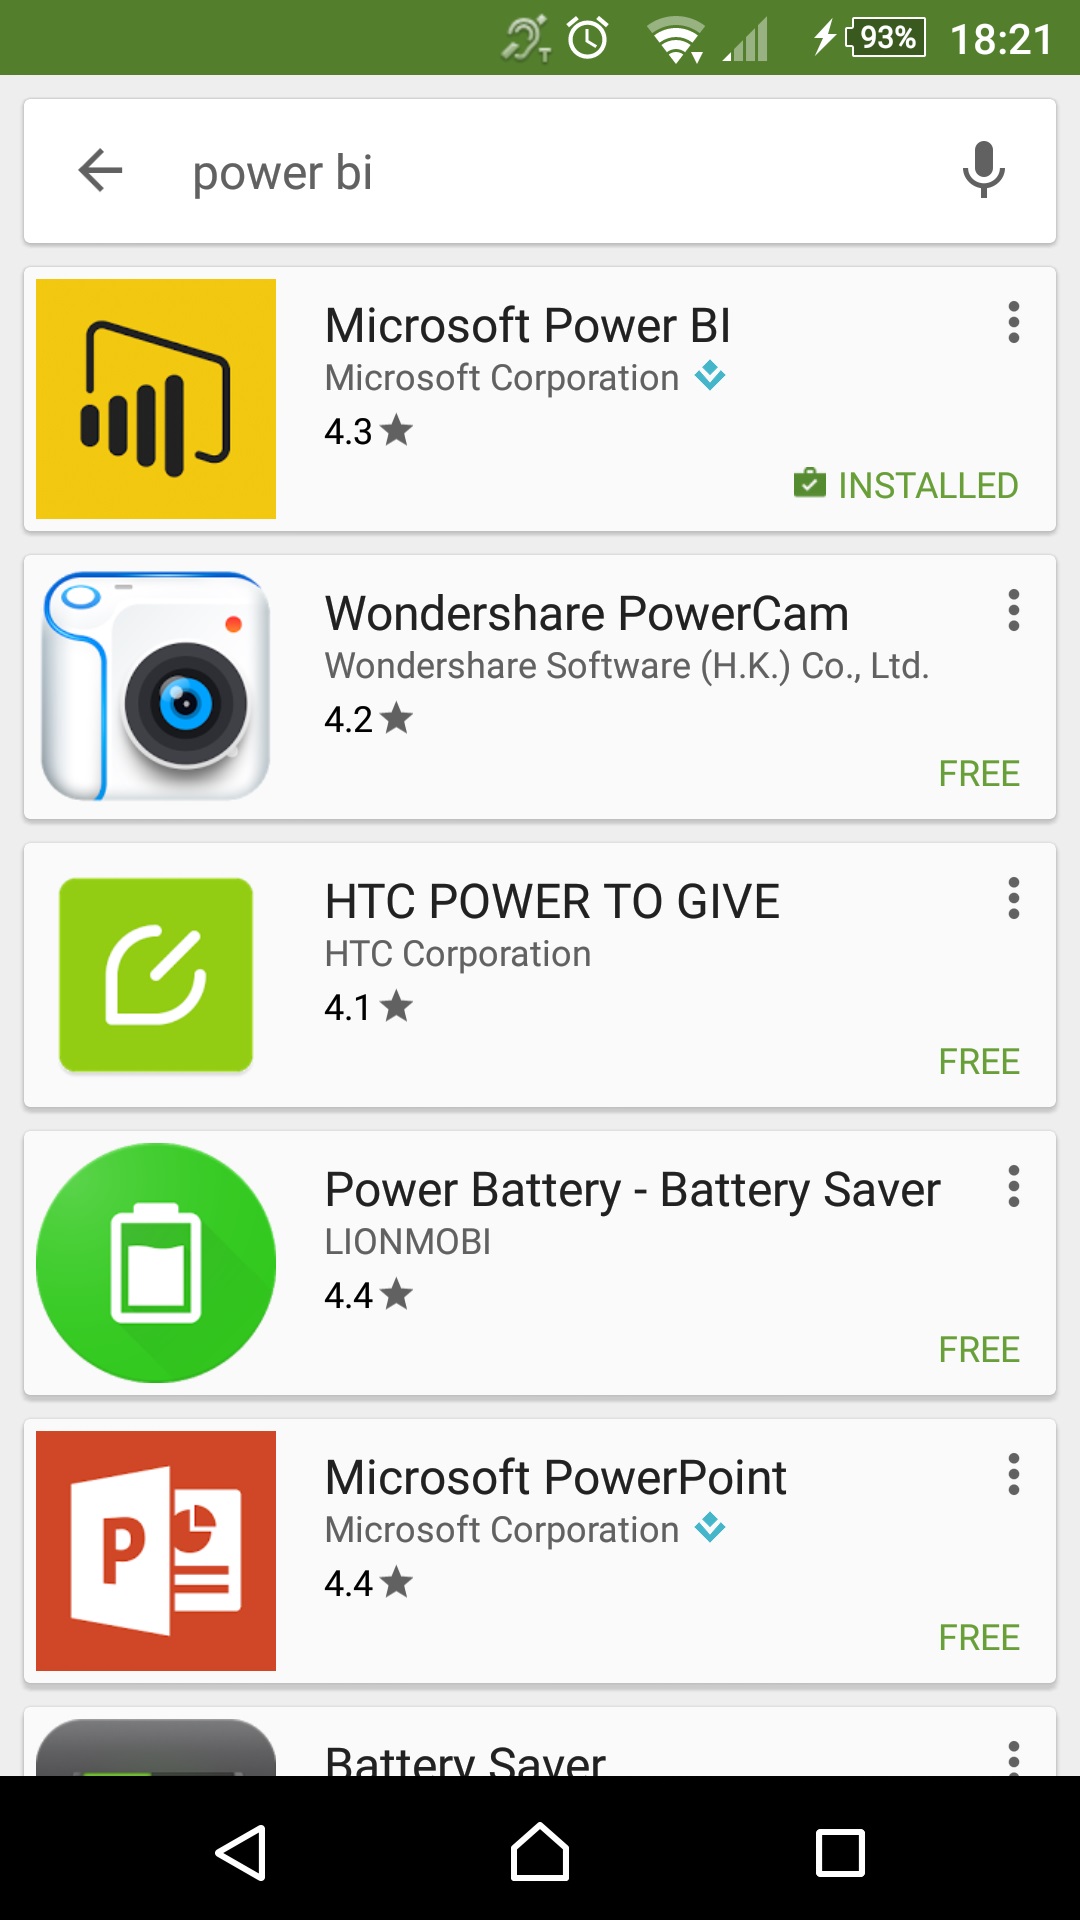
Search for Microsoft Power BI and Install the app.
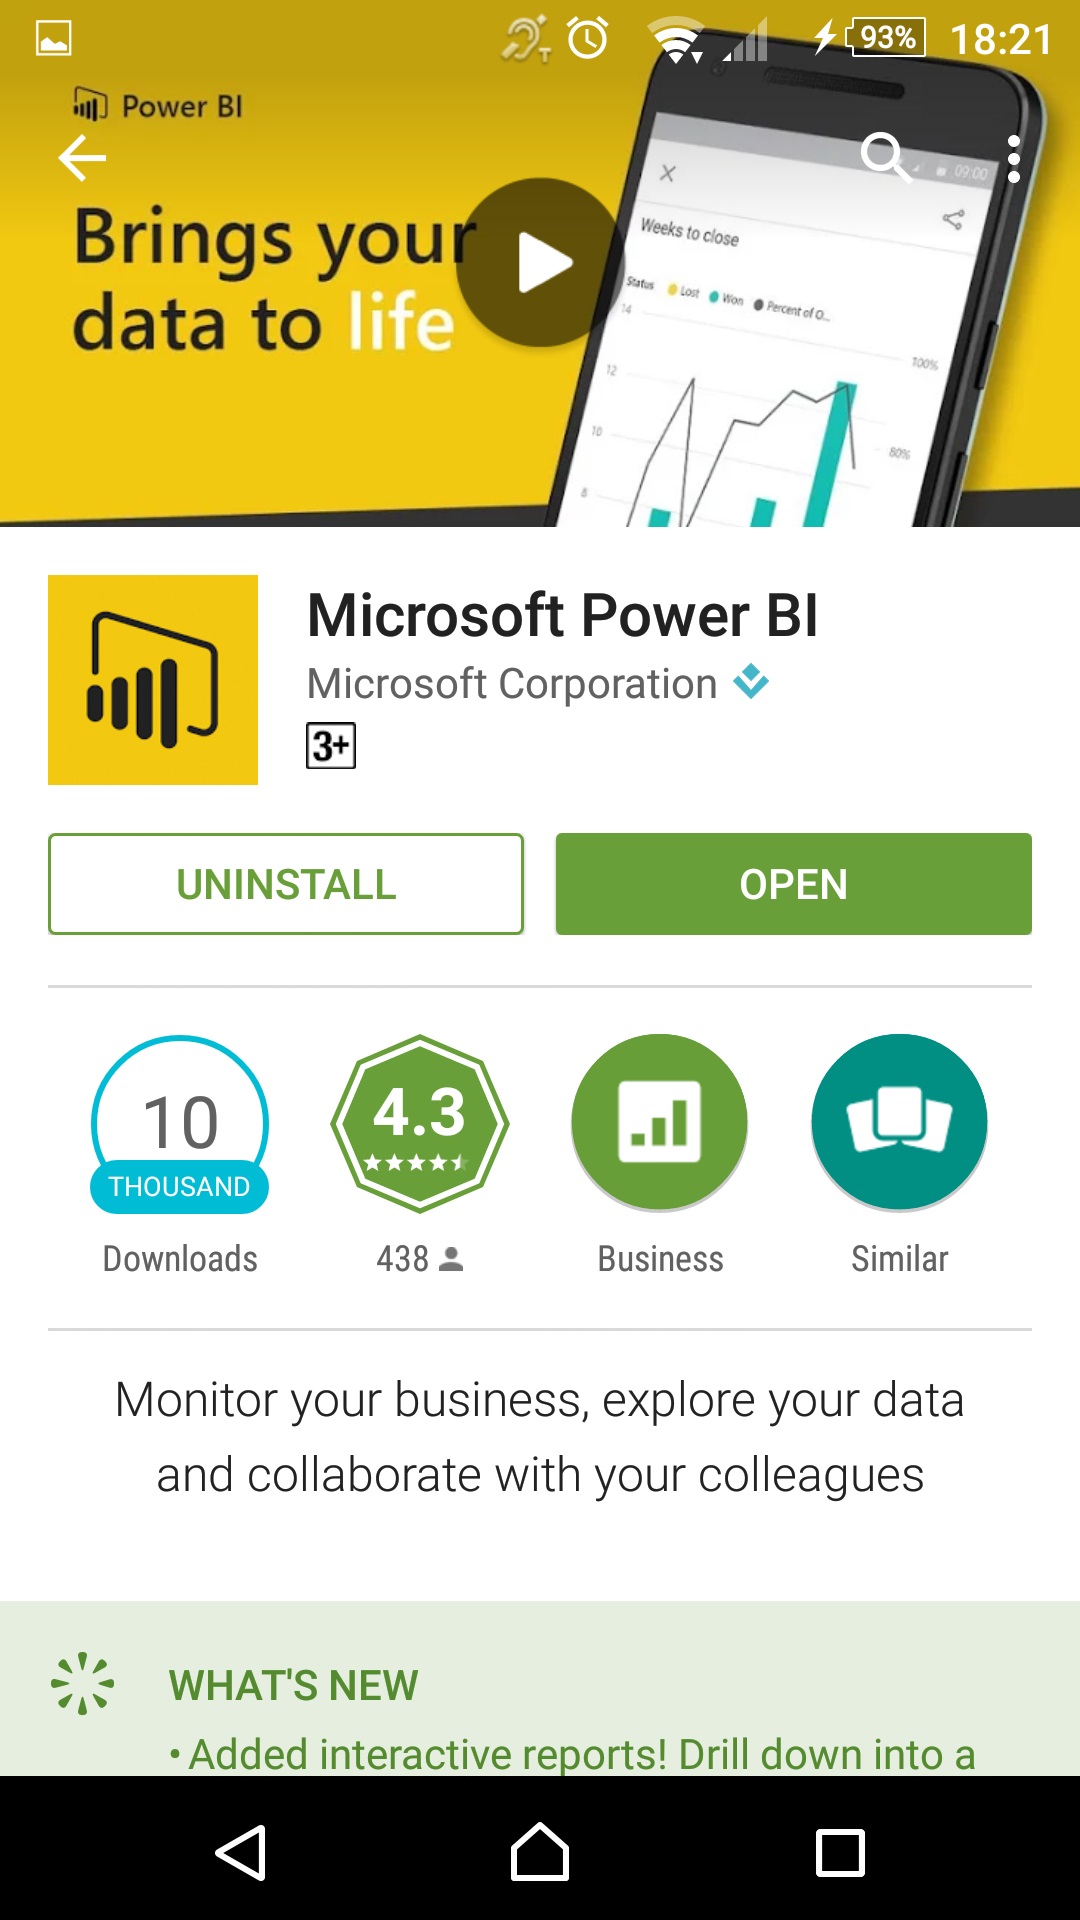
Once the App is Installed Open the App.
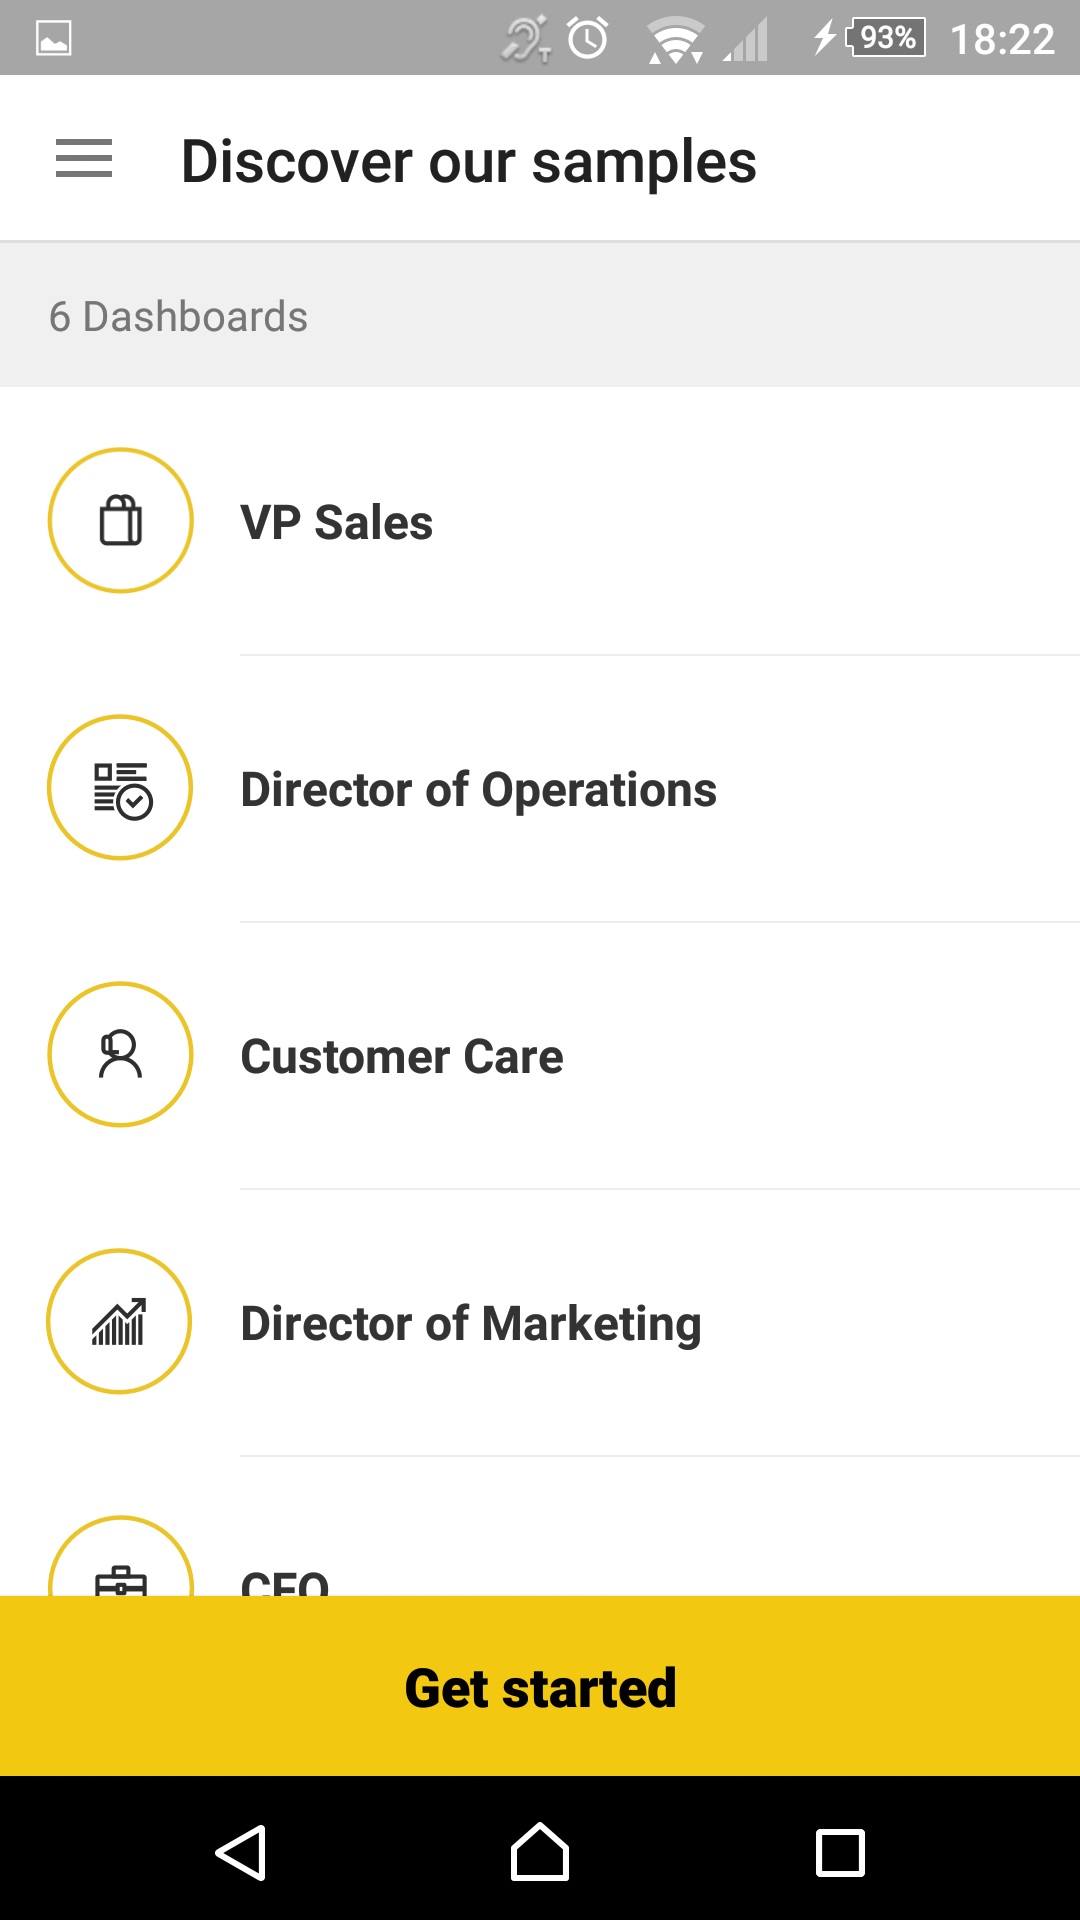
From Home Screen Select Get Started.
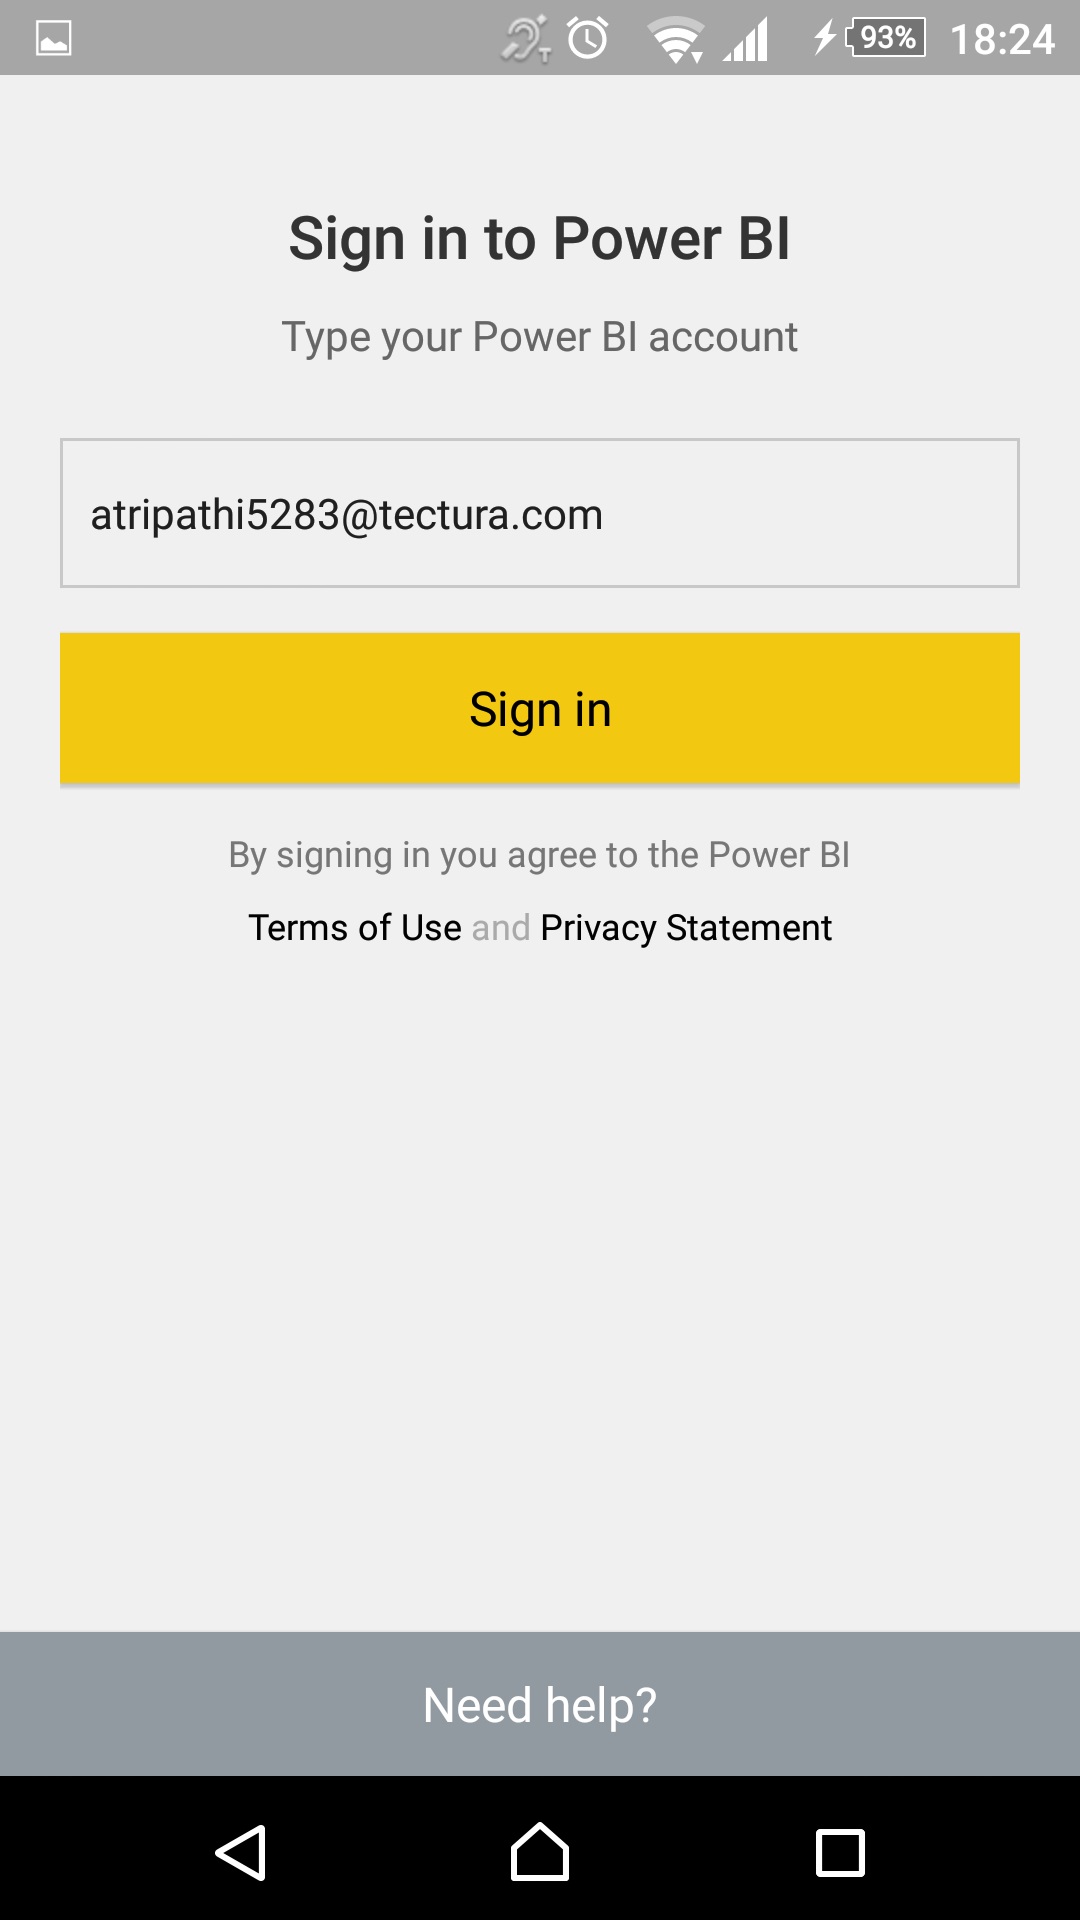
Give your Login details as registered by Power BI and Sign In.
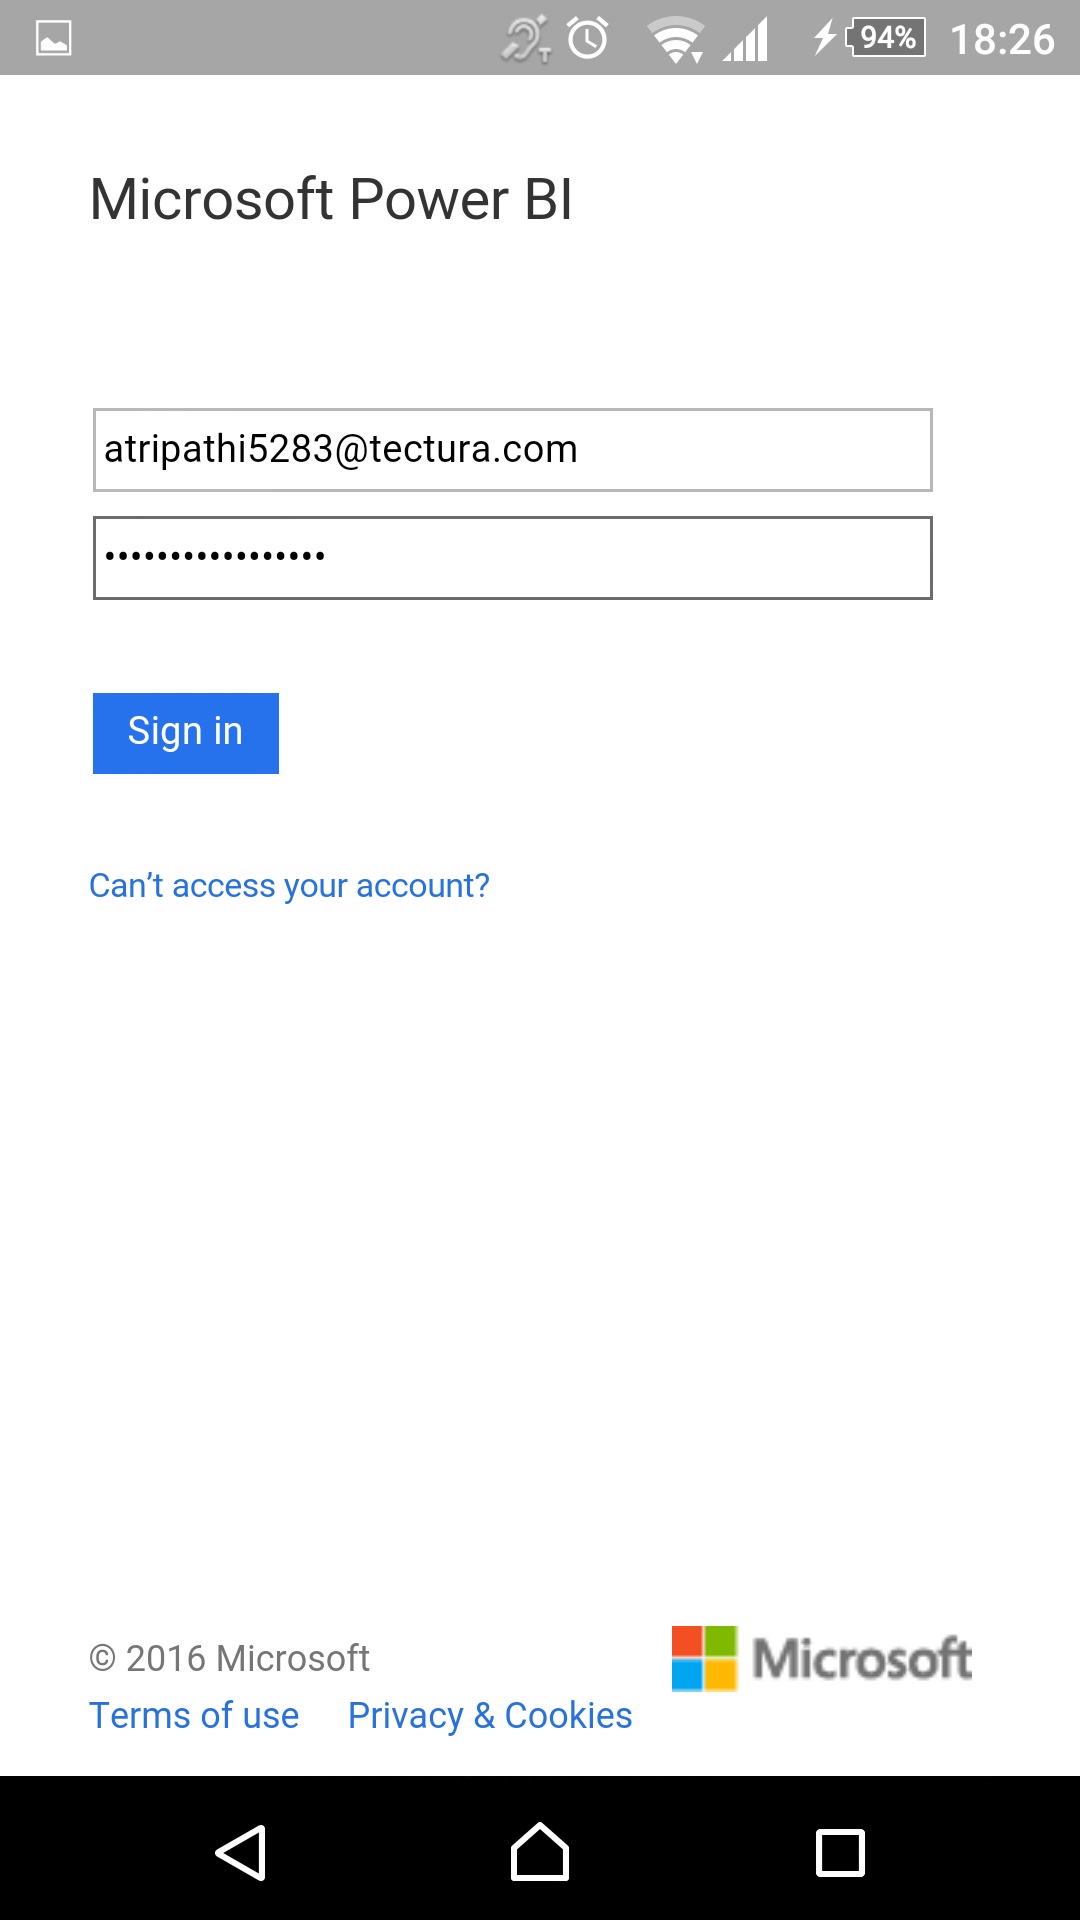
Complete your credentials and Sign In.
Once you are Login, Choose Start Exploring.
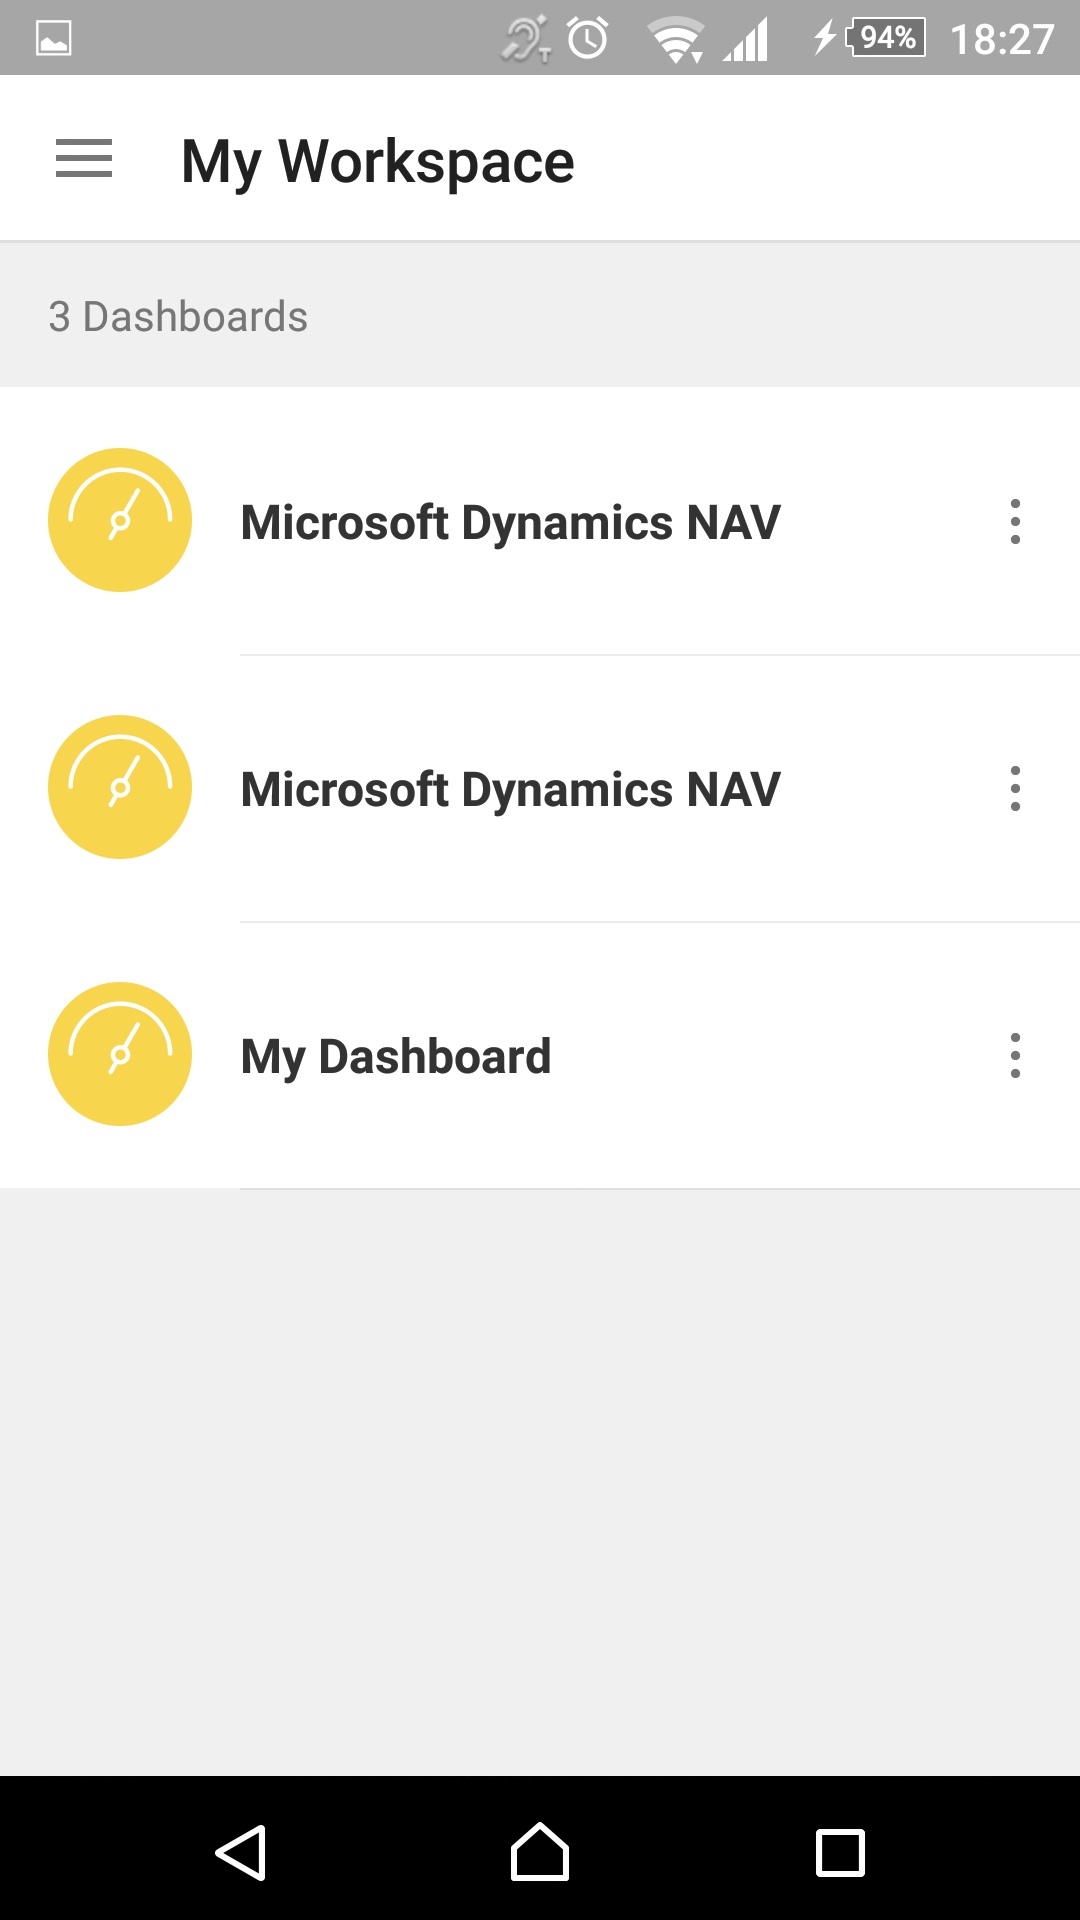
You will get all available Dashboard on your Power BI Portal.
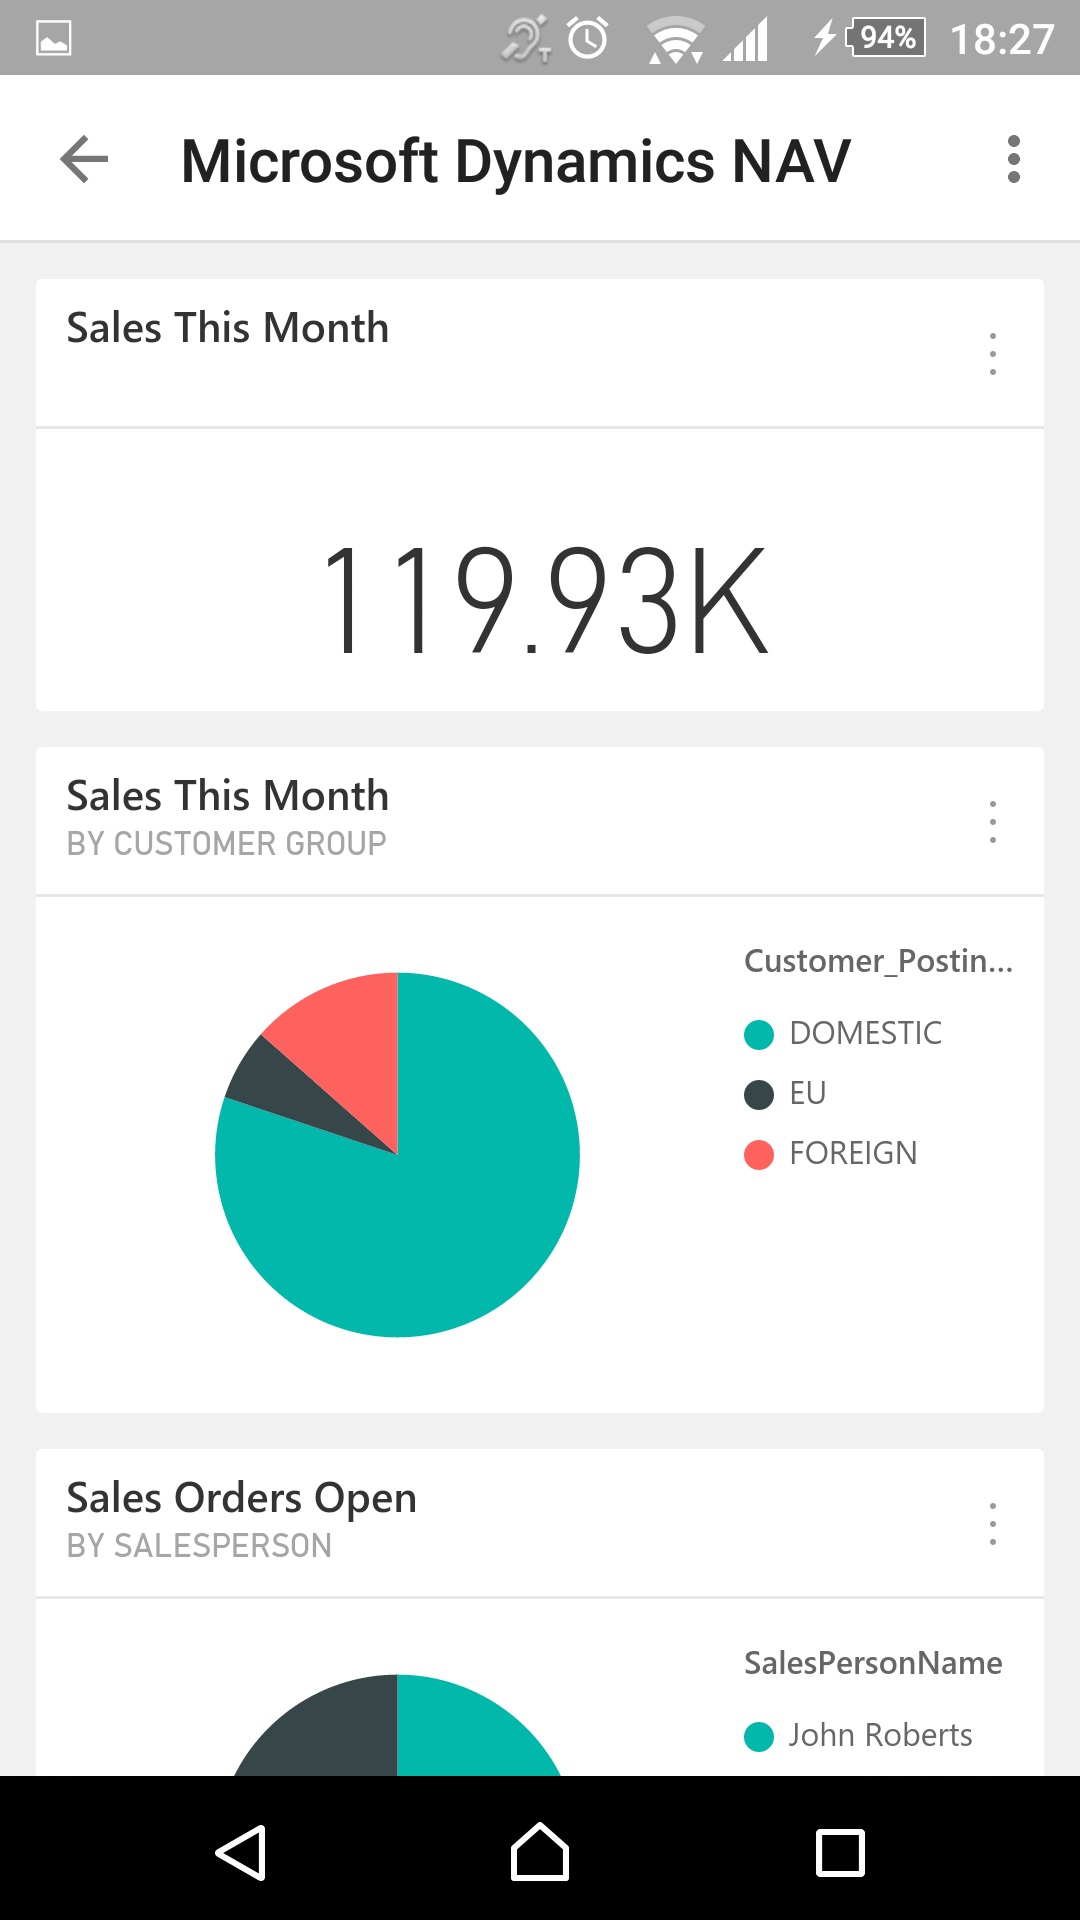
Now you can browse and see your Reports pinned on your Dashboard.
Application have other features need to be explored, different version and on different OS platform you may find features bit different. The app is getting updated from time to time including more features and performance issues.
I will come up with more details on this topic in my upcoming posts.
Till then keep exploring and Learning from different sources available online via blogs and online help on powerbi.com.
You can check:
Microsoft Power BI – Part – I
Microsoft Power BI – Part – II
Microsoft Power BI – Part – III
Microsoft Power BI – Part – IV
Microsoft Power BI – Part – V
Microsoft Power BI – Part – VI
Open the powerbi.com and go to download link of mobile app : https://powerbi.microsoft.com/en-us/mobile/
I have Android so I am selecting Google Play, you select appropriate link as per your mobile OS.
Login with your Google account and choose Install.
Alternatively you can install from your mobile browser.
Search for Microsoft Power BI and Install the app.
Once the App is Installed Open the App.
From Home Screen Select Get Started.
Give your Login details as registered by Power BI and Sign In.
Complete your credentials and Sign In.
Once you are Login, Choose Start Exploring.
You will get all available Dashboard on your Power BI Portal.
Now you can browse and see your Reports pinned on your Dashboard.
Application have other features need to be explored, different version and on different OS platform you may find features bit different. The app is getting updated from time to time including more features and performance issues.
I will come up with more details on this topic in my upcoming posts.
Till then keep exploring and Learning from different sources available online via blogs and online help on powerbi.com.
Microsoft Power BI – Part – VI
Continuing from my previous post, if you have not seen yet please check it out it will help you continuing with this post.
You can check:
Microsoft Power BI – Part – I
Microsoft Power BI – Part – II
Microsoft Power BI – Part – III
Microsoft Power BI – Part – IV
Microsoft Power BI – Part – V
Today we will discuss how to use Power BI Content Pack:
Few things to keep in mind to get report Generated Successfully.
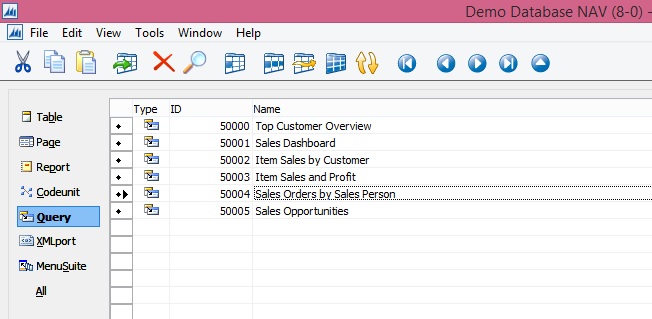
Point-1 You have required objects for this content pack in your database.
If you are using 2016, you can skip this as these objects are available in 2016. If you are using 2015 or 2013 then export these objects from 2016 and import in your database.
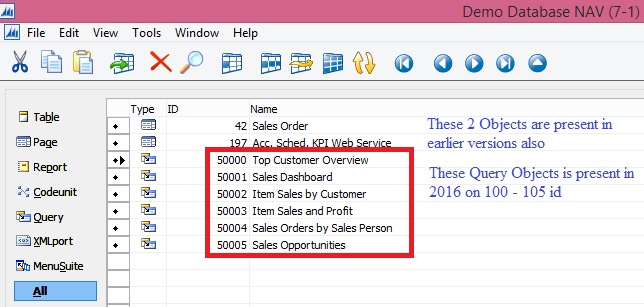
Above Pages will be present in your previous version of database, you need to import the 6 Query objects. These are necessary as these are used as source to fetch data from your data base by this content pack.
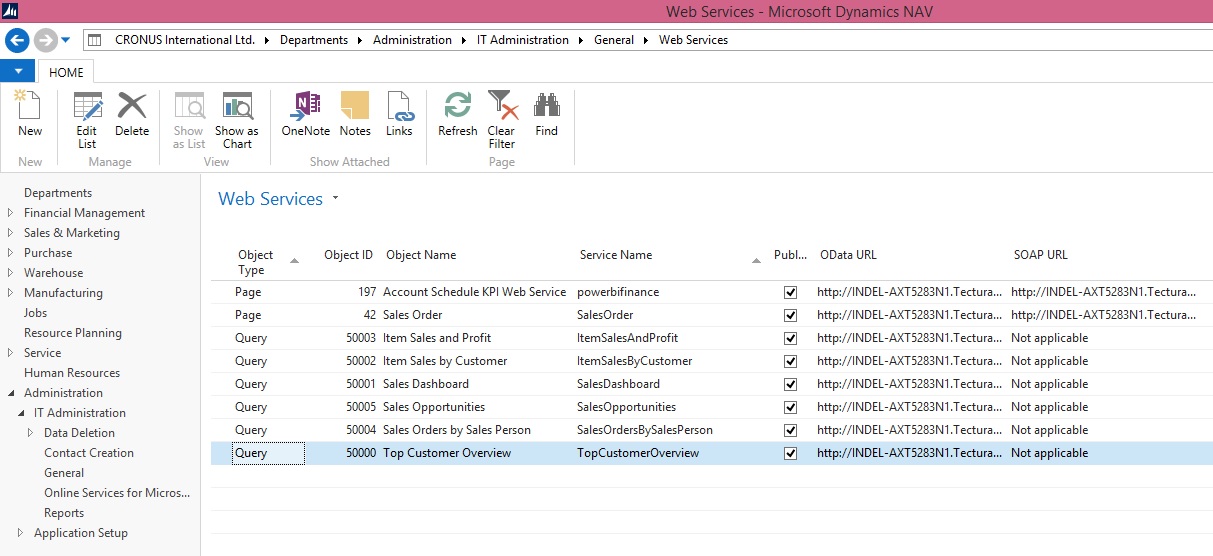
Point-2 Web Services need to be published.
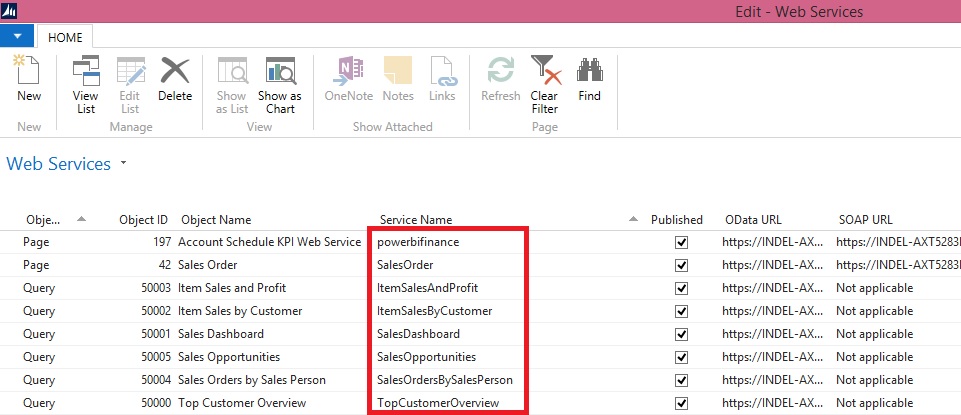
Make sure you use same name for Services as you may get error while connecting and refreshing/ fetching data using this content pack.
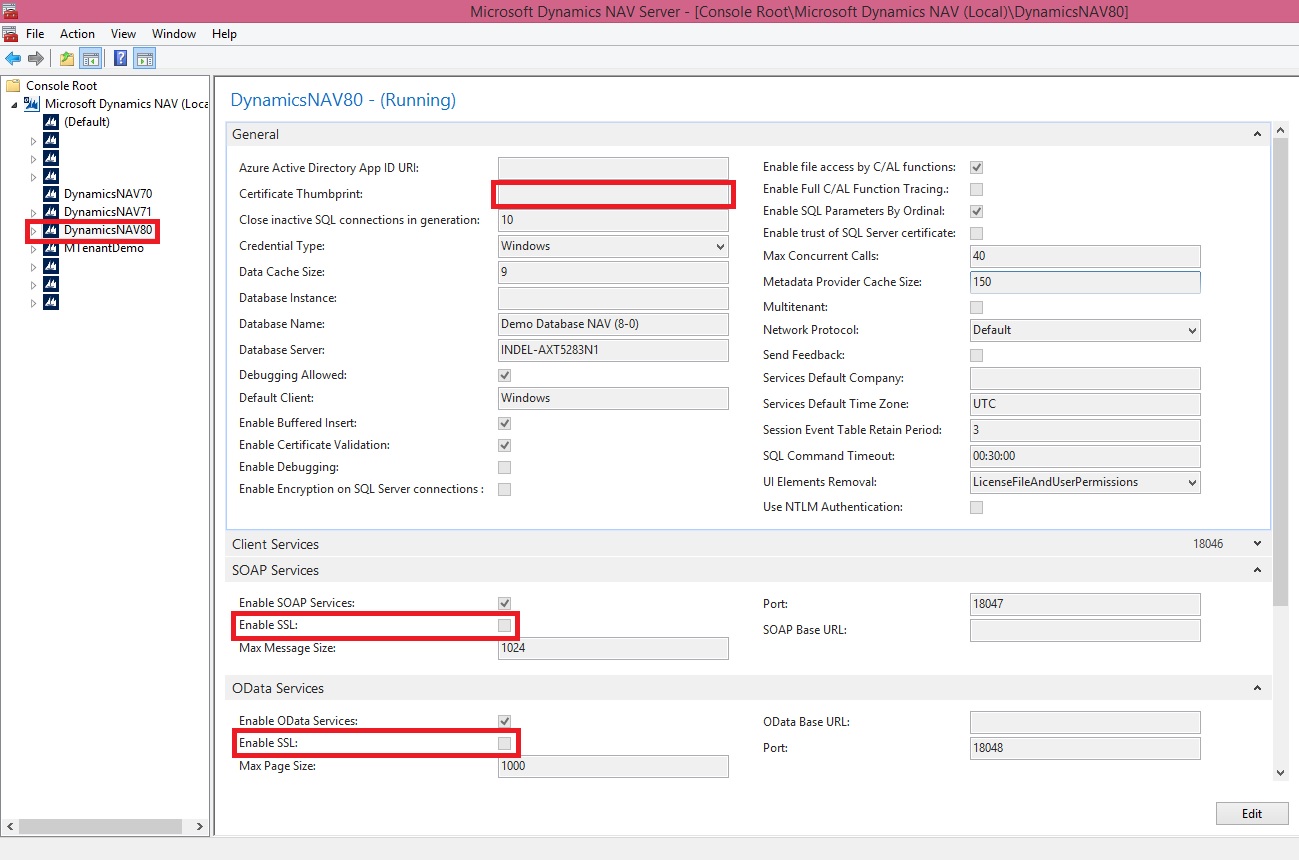
Point-3 SSL port and web address is used to access the services.
https is used as this will not work on http.
Self-signed certificate will not work which we use for test purpose for publishing services and testing. It will throw Trusted relationship connection type error. If you have one use the same instead using Self-signed certificate.
No worries, don’t be disappointed. I will give you tip to overcome this requirement just follow as below:
You may remember that in our previous post we installed and used Power BI Gateway, actually we got a Trusted Certificate which we can use for this purpose.

Open IIS Manager on your system.

Select Serve/ Machine in Left Navigation Tree and Select Server Certificates.
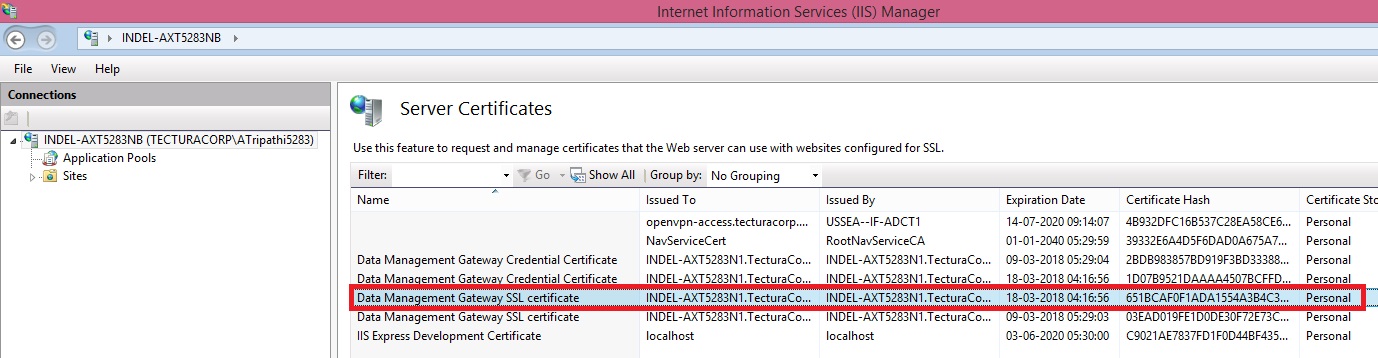
Locate the Data Management Gateway SSL Certificate, this got installed when you installed Gateway. Double click to open the Properties of the certificate.

Switch to Details Tab, Scroll down to find Thumbprint, and Copy the Thumbprint and paste to Notepad finally remove all space leading, trailing and any in between.
It should look like above right bottom corner notepad window no space in Thumbprint signature.
Copy this Value and use as Thumbprint in you Navision Service.
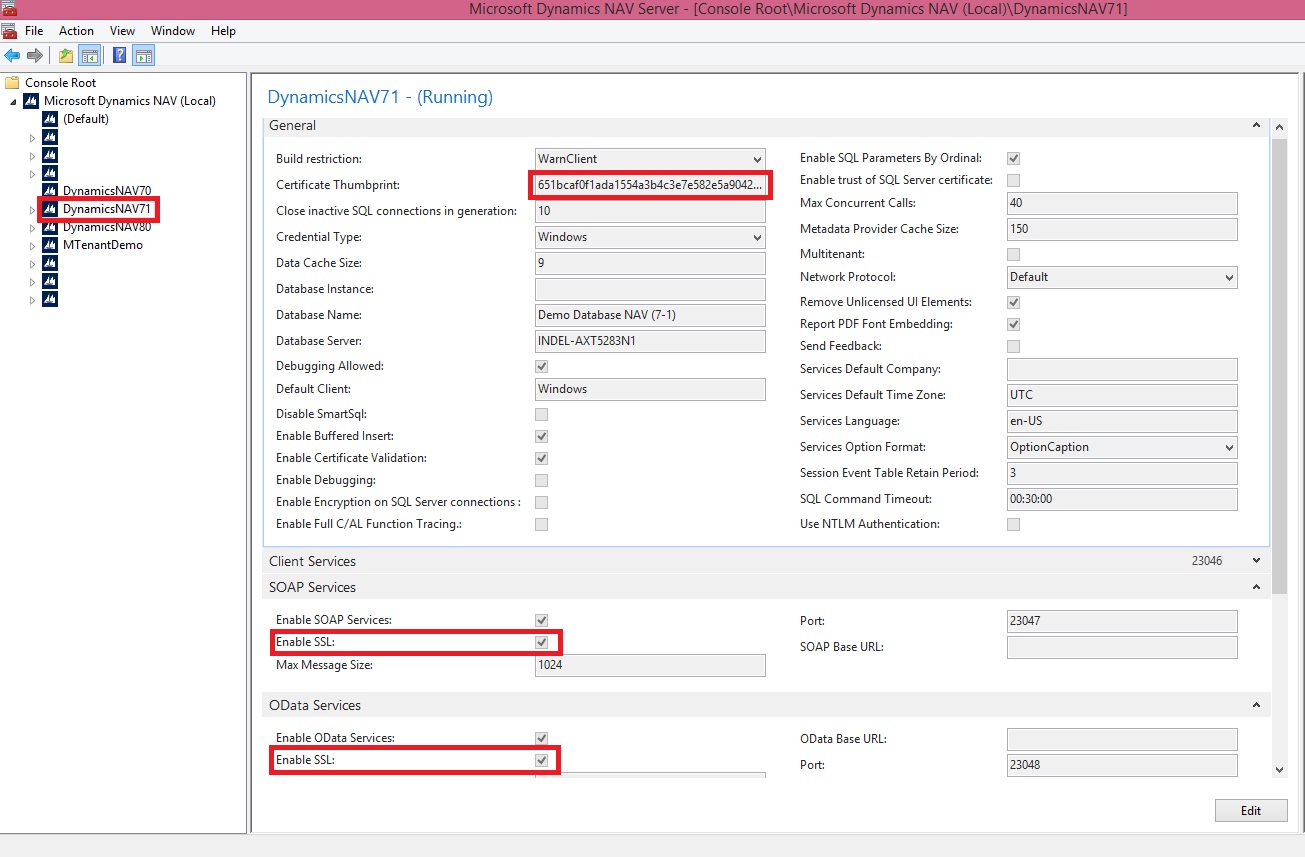
Select Your Service.
Edit.
Paste the Certificate Thumbprint.
Make Sure SSL is Enabled for your OData Services.
Save.
Restart the Service.
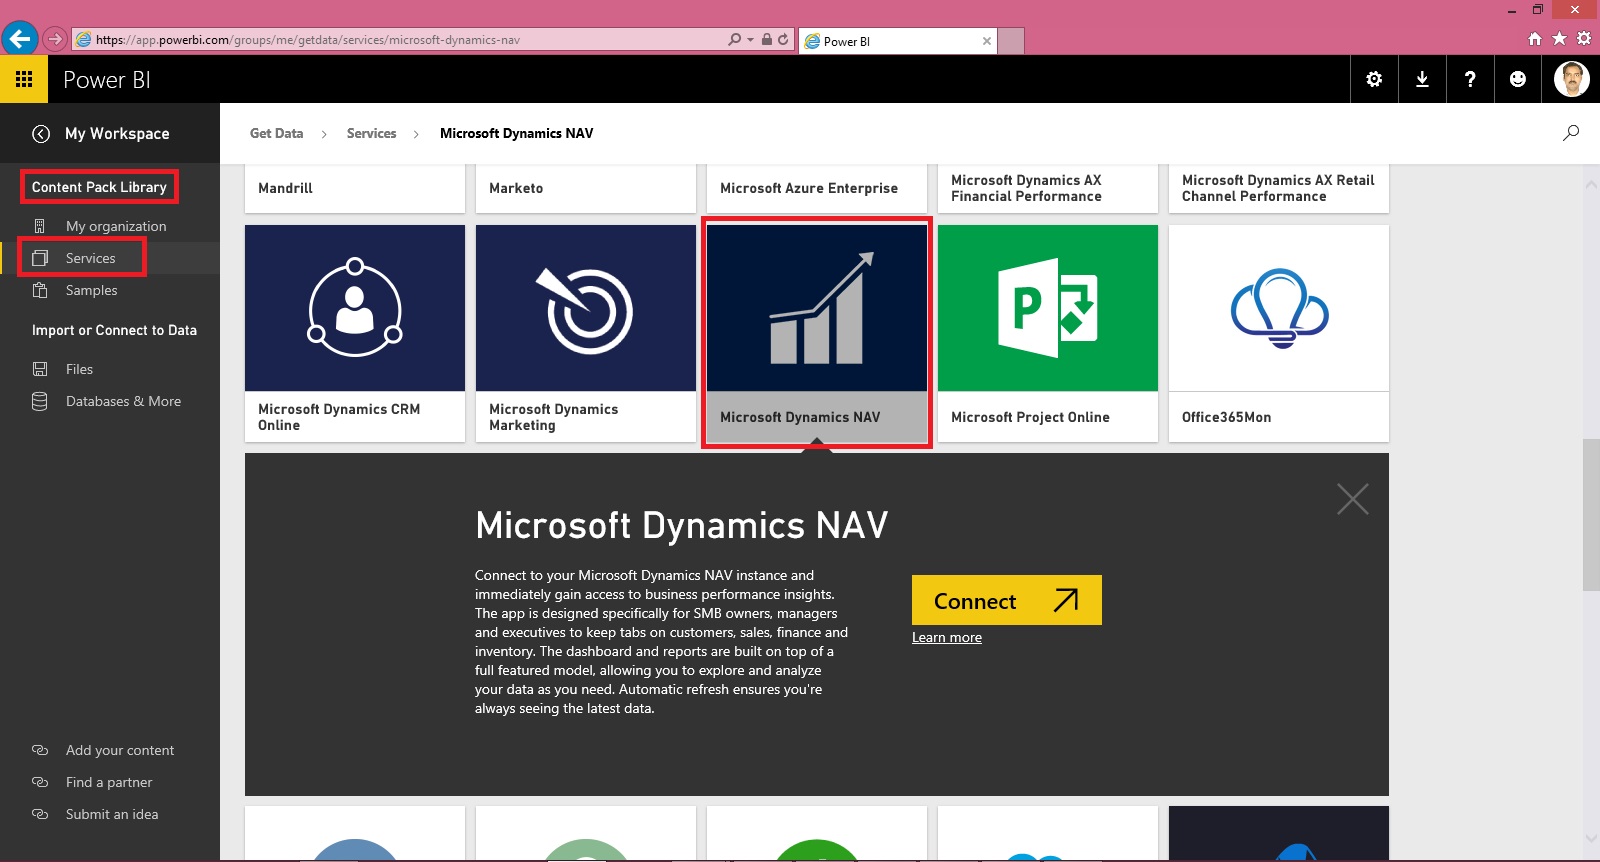
We are done with the basic requirements now let us connect using Power BI Miscrosoft Navision Content Pack.
Now Login with your credentials to Power BI.
From Left bottom corner Select Get Data.
Select Get Data from Services.

Scroll to find Microsoft Dynamics NAV Services and Select Connect.
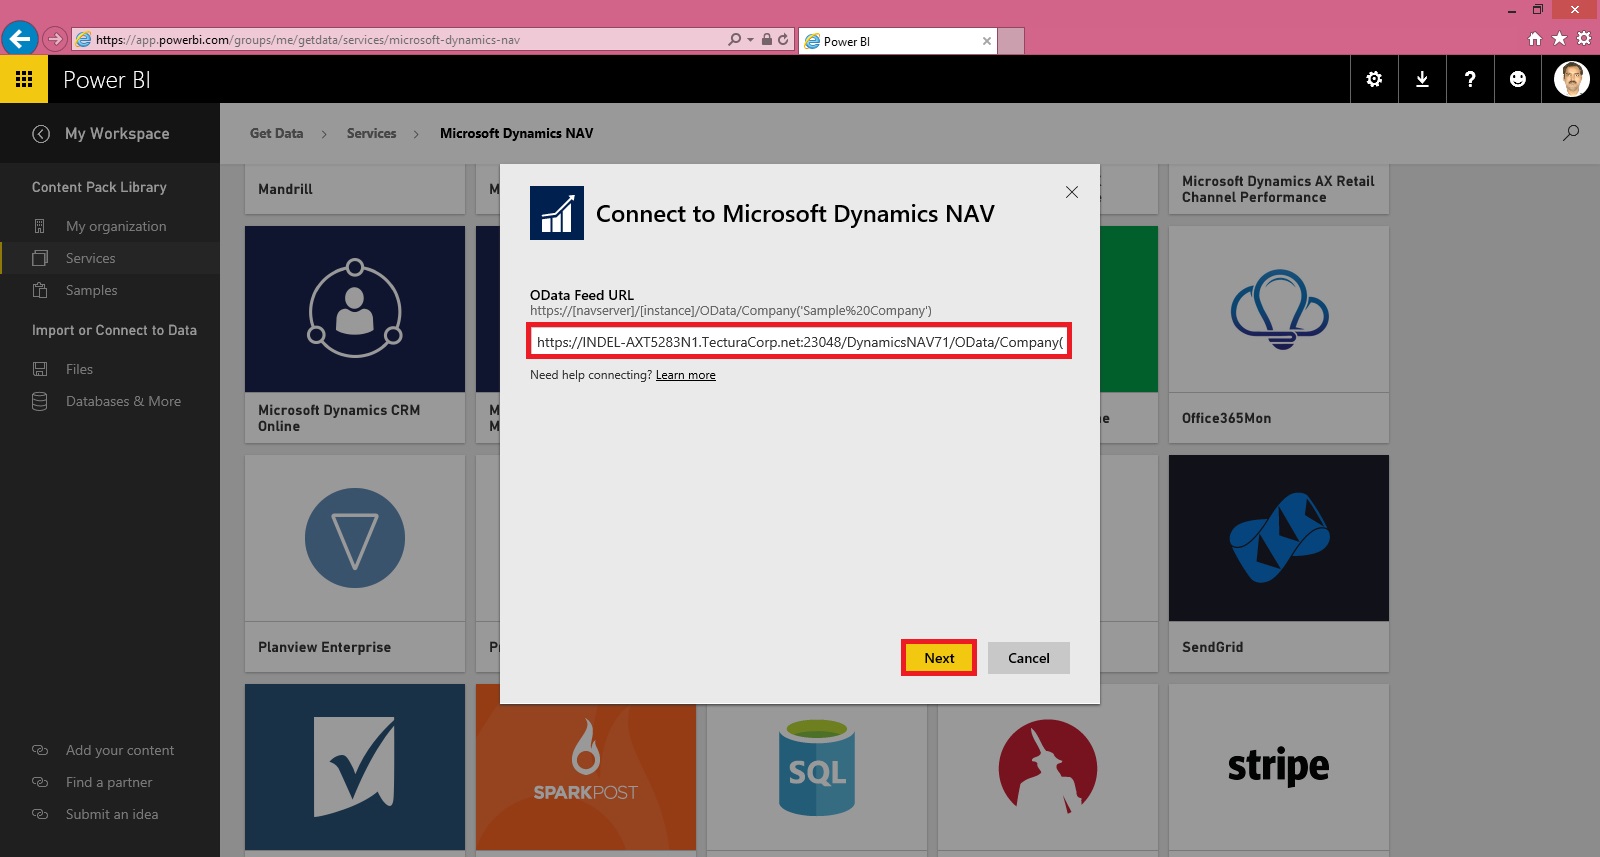
Copy your OData Service URL. Make sure you remove Service name from the URL and trailing ‘/’ after company name from the URL.
Select Next.

Select the Authentication Method and then Sign In.

Wait for few minutes you dataset will be loaded.
As a result you will get: Dataset, Report & Dashboard ready for you in few minutes depending upon the data volume and connection speed.

The report and dashboard view will be as per the available data in your database.
Hurray!!!
You are done with your practice session.
This is a Holi Gift for my reader from my side.
I will come up with more features explanation and other Tips & Tricks in my upcoming posts, till then keep practicing and learning from blogs and helps available online.
You can check:
Microsoft Power BI – Part – I
Microsoft Power BI – Part – II
Microsoft Power BI – Part – III
Microsoft Power BI – Part – IV
Microsoft Power BI – Part – V
Today we will discuss how to use Power BI Content Pack:
Few things to keep in mind to get report Generated Successfully.
Point-1 You have required objects for this content pack in your database.
If you are using 2016, you can skip this as these objects are available in 2016. If you are using 2015 or 2013 then export these objects from 2016 and import in your database.
Above Pages will be present in your previous version of database, you need to import the 6 Query objects. These are necessary as these are used as source to fetch data from your data base by this content pack.
Point-2 Web Services need to be published.
Make sure you use same name for Services as you may get error while connecting and refreshing/ fetching data using this content pack.
Point-3 SSL port and web address is used to access the services.
https is used as this will not work on http.
Self-signed certificate will not work which we use for test purpose for publishing services and testing. It will throw Trusted relationship connection type error. If you have one use the same instead using Self-signed certificate.
No worries, don’t be disappointed. I will give you tip to overcome this requirement just follow as below:
You may remember that in our previous post we installed and used Power BI Gateway, actually we got a Trusted Certificate which we can use for this purpose.
Open IIS Manager on your system.
Select Serve/ Machine in Left Navigation Tree and Select Server Certificates.
Locate the Data Management Gateway SSL Certificate, this got installed when you installed Gateway. Double click to open the Properties of the certificate.
Switch to Details Tab, Scroll down to find Thumbprint, and Copy the Thumbprint and paste to Notepad finally remove all space leading, trailing and any in between.
It should look like above right bottom corner notepad window no space in Thumbprint signature.
Copy this Value and use as Thumbprint in you Navision Service.
Select Your Service.
Edit.
Paste the Certificate Thumbprint.
Make Sure SSL is Enabled for your OData Services.
Save.
Restart the Service.
We are done with the basic requirements now let us connect using Power BI Miscrosoft Navision Content Pack.
Now Login with your credentials to Power BI.
From Left bottom corner Select Get Data.
Select Get Data from Services.
Scroll to find Microsoft Dynamics NAV Services and Select Connect.
Copy your OData Service URL. Make sure you remove Service name from the URL and trailing ‘/’ after company name from the URL.
Select Next.
Select the Authentication Method and then Sign In.
Wait for few minutes you dataset will be loaded.
As a result you will get: Dataset, Report & Dashboard ready for you in few minutes depending upon the data volume and connection speed.
The report and dashboard view will be as per the available data in your database.
Hurray!!!
You are done with your practice session.
This is a Holi Gift for my reader from my side.
I will come up with more features explanation and other Tips & Tricks in my upcoming posts, till then keep practicing and learning from blogs and helps available online.
Subscribe to:
Posts (Atom)