This report will contain all the Functions, Commands we discussed till now and usage of NP & NL Functions.
You can refer my earlier posts for more detailed information which will help you understanding this report better, for your convenience I am providing link to previous posts which may help you understanding the terms being used in this report.
Using Jet Report NL Function
Using Jet Report NF Function
Using NL( Lookup ) in Jet Reports Part-1
Using NL( Lookup ) in Jet Reports Part-2
Using NL( Lookup ) in Jet Reports Part-3
Using NP Function in Jet Reports
Using GL Function in Jet Reports
Let’s start with creating Option Page before we start with report creation:

If you see in above sheet few filters are defined for the report, most of them are normal and Lookup which we have already discussed in previous report and posts.
Please be sure ‘=’ have been removed from formulas for presentation purpose, make sure you add them when use in your report.
Here new thing which we see is in E3 Cell:
=NP("DateFilter",StartDate,EndDate)
Here NP function creates a filter variable date filter which takes the StartDate & EndDate to create filter in Navision format like 01/01/2015..31/12/2015, which can be used in other Jet Functions as an parameter.
Option denotes these value will be asked from user when report is executed.
Lookup provides List of Values for selection to the user.
All text in A Column & Row 1 are the keywords or reserved words of the Jet Reports.
All text B3..B8 are Text or Option Heading which will be displayed in Option form when report is executed.
All text C3..C8 are the default Values for the options, remember (*) means no filters applied or include all. Don’t Forget to define Name of the cells in Name box, you will find this in the Left of the Formula Bar. The name I am using in my report defined below, this will help us using these user friendly name as filter in our Functions.
| Cell | Name |
| C3 | StartDate |
| C4 | EndDate |
| C5 | GLAccountNo |
| C6 | BudgetName |
| C7 | PeriodType |
| C8 | BlankZero |
| E3 | DateFilter |
Let’s Start our Report Design, Insert one more sheet for report format design.
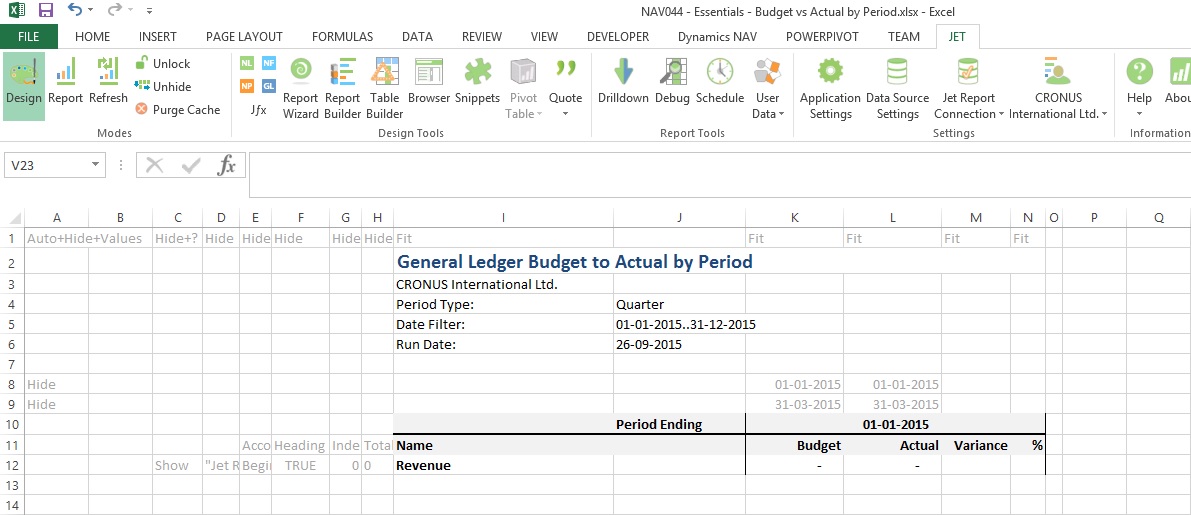
Our design will be as follows, we will discuss the formula used in these columns later below in this post.

The Jet Formulas we are using in above sheet is as below:
| Cell | Formula |
| I3 | =NL(,"Company Information","Name") |
| J4 | =PeriodType |
| J5 | =NP("DateFilter",StartDate,EndDate) |
| J6 | =NP("Eval","=Today()") |
| K8 | =NL("Columns=5",NP("Dates",StartDate,EndDate,PeriodType)) |
| K9 | =NL(,NP("Dates",K8,"30/12/2050",PeriodType,TRUE)) |
| C12 | =IF(AND(Heading=FALSE,BlankZero="Yes",MIN(K12:Q12)=0,MAX(K12:Q12)=0),"Hide","Show") |
| D12 | =NL("Rows","G/L Account",,"No.",GLAccountNo,"Date Filter",DateFilter) |
| E12 | =NF($D12,"Account Type") |
| F12 | =OR(AccountType="Heading",AccountType="Begin-Total") |
| G12 | =NF($D12,"Indentation") |
| H12 | =IF(E12="Posting",NF(D12,"No."),IF(OR(E12="Total",E12="End-Total"),NF(D12,"Totaling"),"0")) |
| I12 | =REPT(" ",G12*5) & NF($D12,$I$11) |
| K12 | =GL("Budget",$H12,ColumnStartDate,ColumnEndDate,,,,,,,BudgetName) |
| L12 | =GL("Balance",$H12,ColumnStartDate,ColumnEndDate) |
We can mix and match Excel formulas too to achieve data we require in our report especially any calculation of values from other cell values. You may find many of them is being used in this report too. You can apply formatting of Excel for better presentation of your reports. Sometime cell references to help in repeating the value to the cells and making available to access to upcoming cells when report is executed.
In Cell C1 [Hide+?] denotes this column will be used to get decision at run time like if we want to hide or show the respective row. As this value will not be available at design time, but when report is executed some rows we want to hide from the output of the report to user. Anything we are sure and know well in advance that this row need to be Hide we can key [Hide] in column A of that Row.
See in Cell C12 formula: [=IF(AND(Heading=FALSE,BlankZero="Yes",MIN(K12:Q12)=0,MAX(K12:Q12)=0),"Hide","Show")]
Here decision is taken either we need to Show/Hide this row from output depending upon the test value. This value will be only available when data is retrieved and presented in Report, at design time we cannot predict what will be the value in these column and what will be the result of our test.
If we want to Hide any Row we Key [Hide] in A Column of that Row, Similarly if we want to Hide any Column we Key [Hide] in Row 1 of that Column.
Column L8 & L9 simply copy Value of K8 & K9 Respectively. K10 =K8 here too value is copied.
Rest All Values are Simple text used for Heading in Report Output.
[=REPT] this is Excel Formula Repeats text a given number of times. Use REPT to fill a cell with a number of instances of a text string.
Syntax: REPT(text, number_times)
The Cell M12 usage simple Excel Formula [=K12-L12].
The Cell N12 also usage simple Excel Formula [=IF(K12=0,"",ROUND((M12/K12),2))]
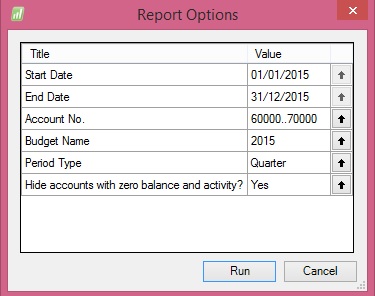
On executing the Report I fill below Filters:

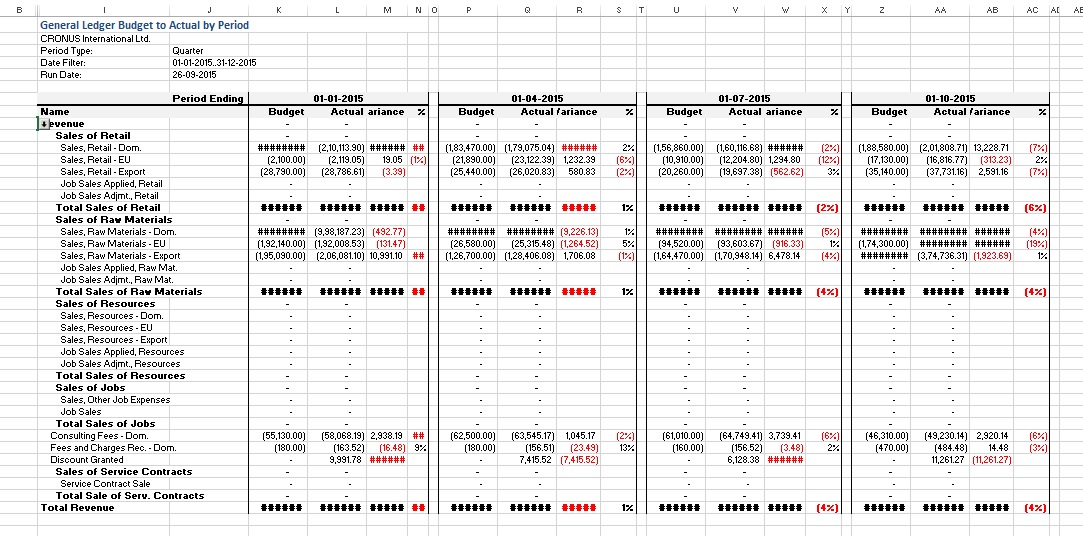
Applying above Filters the Output of report from my Standard Navision 2015 Report I get below Output:

Due to size limit I have reduced the zoom of the excel so that the exact report output in full can be shown.
Remain tuned for more information.
I will come up with more details in my upcoming posts.
[…] Creating Report in Jet Using NL, NF, NP & GL & Excel Formulas […]
ReplyDelete[…] Bron : Ashwini Tripathi Lees meer… […]
ReplyDelete