If you missed them you can follow below links to refresh all information.
PowerPivot for Excel
PowerPivot Creating a Data Model in Excel 2013
Adding more tables to the Data Model using Existing Connection – In PowerPivot
Add relationships to Data Model in PowerPivot
How to add Filter for data retrieval in PowerPivot Data model.
Create a calculated column in PowerPivot
We have learned basic actions, let’s create our first Report.
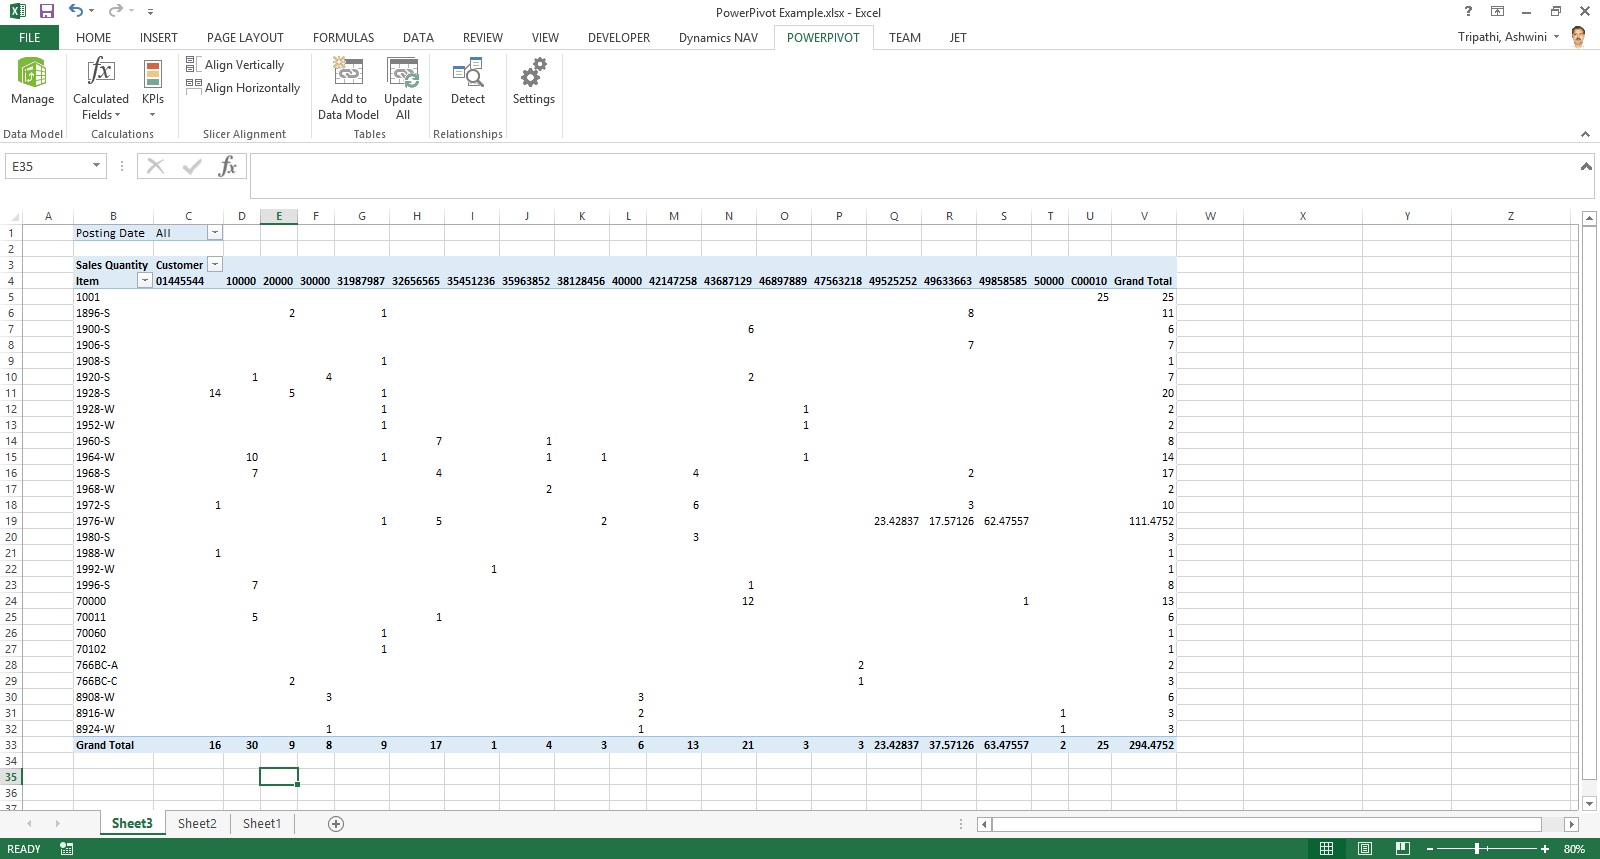
I will be creating Pivot Matrix Customer Vs Item Sales.
Open the Excel in which we created our Data model and imported our table data.
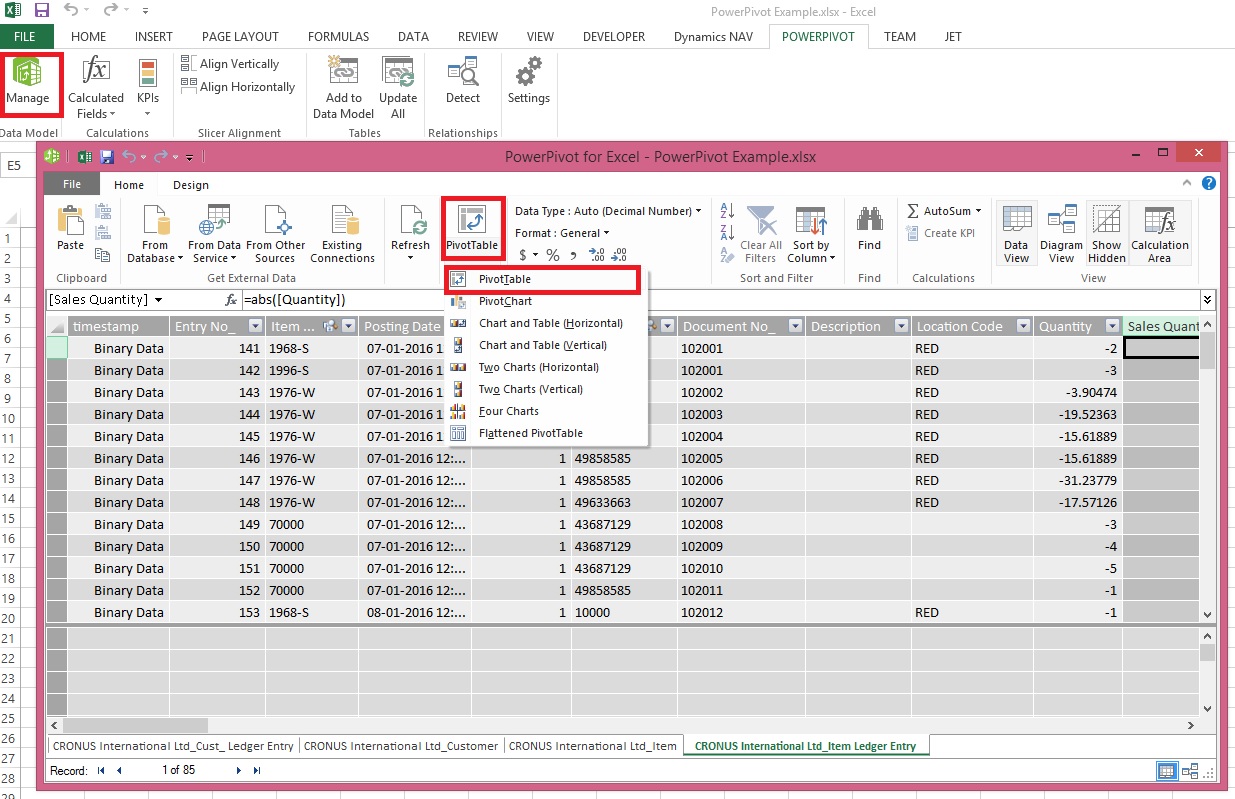
Select PivotTable From Ribbon under Home Tab.
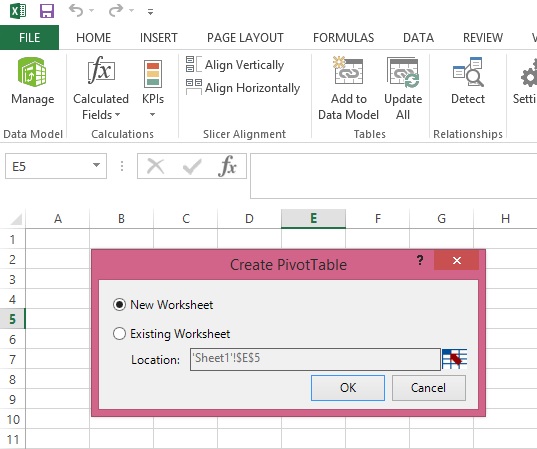
Select New Worksheet or Existing Worksheet as per the case.
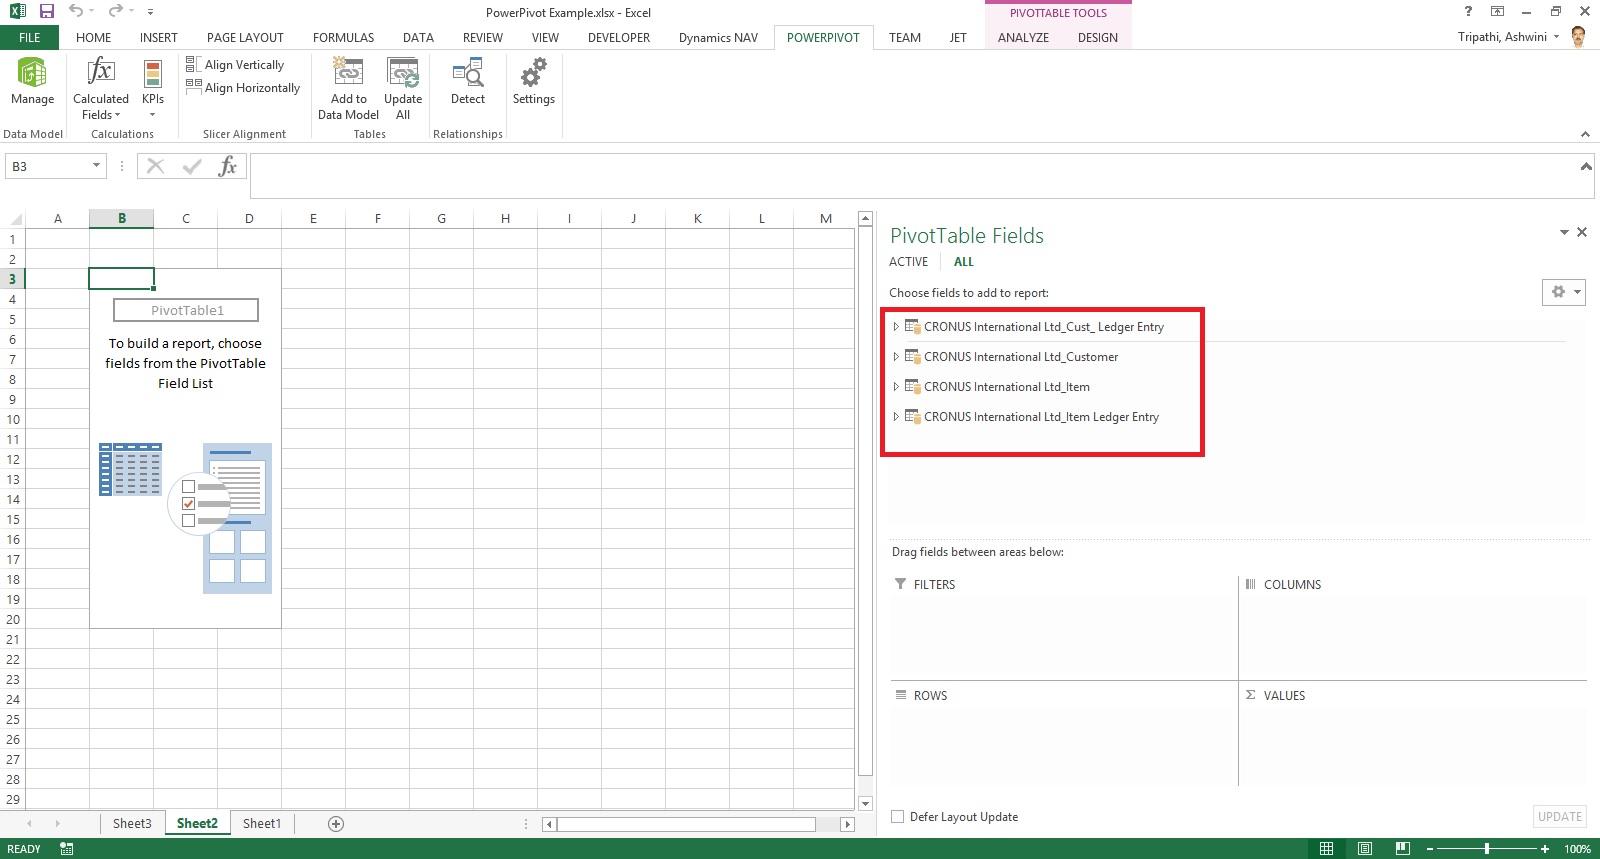
You will see a Pivot is inserted, in right side you will find all the tables available in the Data model of this Worksheet.
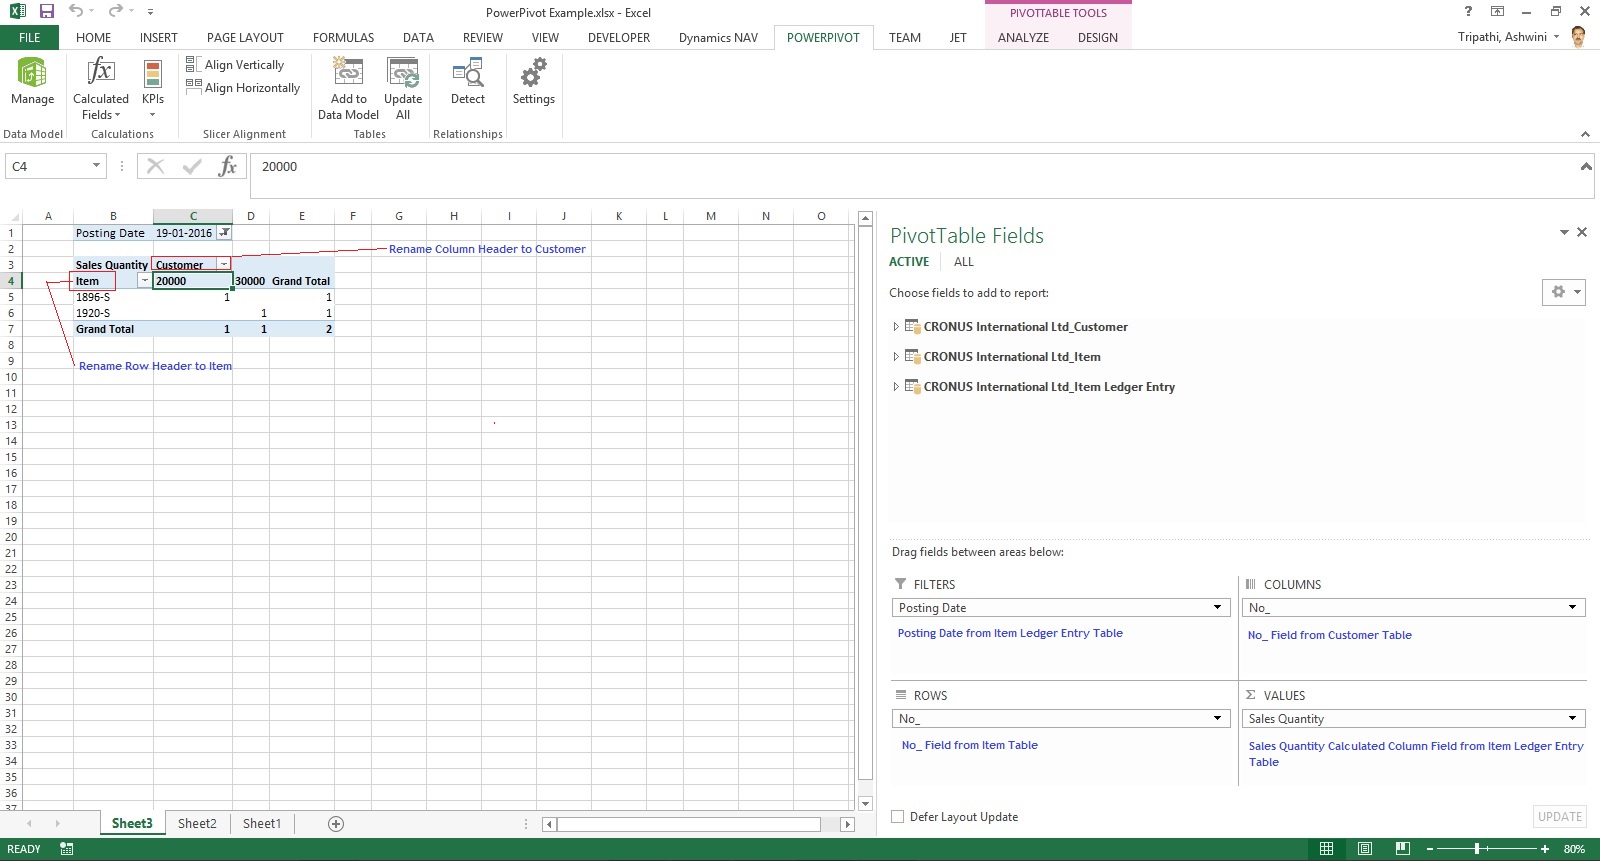
Design the Pivot as above screenshot.
The output of this report will be as below if executed without Date Filter.
I will come up with more details and features of PowerPivot in my upcoming posts. Till then keep practicing and stay tuned for more details on this topic.
[…] Creating My First Report using PowerPivot […]
ReplyDelete[…] from my earlier post Creating My First Report using PowerPivot in which we created a Items Vs Customer Sales matrix […]
ReplyDelete[…] from my earlier post Creating My First Report using PowerPivot in which we created a Items Vs Customer Sales matrix […]
ReplyDelete[…] from my previous post Creating My First Report using PowerPivot, I will be using same Data Model to demonstrate the feature of Power View, also same report in […]
ReplyDelete[…] from my previous post Creating My First Report using PowerPivot, I will be using same Data Model to demonstrate the feature of Power View, also same report in […]
ReplyDelete