Wednesday, 19 August 2015

TextEncoding Property (XMLports)

Specifies the text encoding format to use when you use an XMLport to export or import data as text.

Note

The TextEncoding property is only available when the Format Property (XMLports) of the XMLport is set to Fixed Text or Variable Text.

Values

  • MS-DOS (default)

  • UTF-8

  • UTF-16

  • Windows


Remarks

Text encoding is the process of transforming bytes of data into readable characters for users of a system or program. There are several industry text encoding formats and different systems support different formats. Internally, Microsoft Dynamics NAV uses Unicode encoding. For exporting and importing data with an XMLport, Microsoft Dynamics NAV supports MS-DOS, UTF-8, UTF-16, and Windows encoding formats.

You should set the TextEncoding property to the encoding format that is compatible with the system or program that you will be exporting to or importing from. The following sections describe the available text encoding formats.

Tip

You can also set the TextEncoding property in C/AL code. For example, if your XMLport can import or export different formats based on certain conditions, you can change the encoding on the fly depending on the conditions. For example, you can write code such as the following:

currXMLport.TEXTENCODING := TEXTENCODING::Windows;

Example

The following code example illustrates how you can set the encoding during run time.

TextEncoding

Above screenshot is from XMLport 1220 in the CRONUS International Ltd. demonstration database.

Sample Code:

...
      CASE MyDefinitionTable."File Encoding" OF

MyDefinitionTable."File Encoding"::"MS-DOS":

currXMLport.TEXTENCODING(TEXTENCODING::MSDos);

MyDefinitionTable."File Encoding"::"UTF-8":

currXMLport.TEXTENCODING(TEXTENCODING::UTF8);

MyDefinitionTable."File Encoding"::"UTF-16":

currXMLport.TEXTENCODING(TEXTENCODING::UTF16);

MyDefinitionTable."File Encoding"::WINDOWS:

currXMLport.TEXTENCODING(TEXTENCODING::Windows);

...

The table, MyDefinitionTable, (Imaginary Table) has a field, File Encoding, (imaginary Field) that specifies the encoding for this part of an import.

Enhancing Microsoft Dynamics NAV Server Security

Microsoft Dynamics NAV Server is a .NET-based Windows Service application that works exclusively with SQL Server databases.

Microsoft Dynamics NAV Server provides an additional layer of security between clients and the database. It leverages the authentication features of the Windows Communications Framework to provide another layer of user authentication and uses impersonation to ensure that business logic is executed in a process that has been instantiated by the user who submitted the request. This means that authorization and logging of user requests are performed on a per-user basis.

Login Account

After you install Microsoft Dynamics NAV Server, the default configuration is for the service to log on using the NT Authority\Network Service account. If Microsoft Dynamics NAV Server and SQL Server are on different computers, then MS recommends that you configure Microsoft Dynamics NAV Server to log on using a dedicated Windows domain user account instead. This account should not be an administrator either in the domain or on any local computer. A dedicated domain user account is considered more secure because no other services and therefore no other users have permissions for this account.

Disk Quotas

Client users can send files to be stored on Microsoft Dynamics NAV Server, so MS recommend that administrators set up disk quotas on all computers running Microsoft Dynamics NAV Server.

This can prevent users from uploading too many files, which can make the server unstable. Disk quotas track and control disk space usage for NTFS volumes, which allows administrators to control the amount of data that each user can store on a specific NTFS volume.

Limiting Port Access

The Microsoft Dynamics NAV Setup program opens a port in the firewall on the computer where you install Microsoft Dynamics NAV Server. By default, this is port 7046.

To improve security, you can consider limiting access to this port to a specific subnet. One way is to use netsh, which is a command-line tool for configuring and monitoring Windows-based computers at a command prompt.

The specific version of this command that you would use is netsh firewall set portopening. For example, the following command limits access to port 7046 to the specified addresses and subnets:

netsh firewall set portopening protocol=TCP port=7046 scope=subnet addresses=LocalSubnet

You can learn more on netsh command here.

Tuesday, 18 August 2015

Using Query Object to Calculate the Cue Data

Today we will learn to create a query to update Cue data.
SI-Cue-1

Creating a Query for Calculating the Cue Data
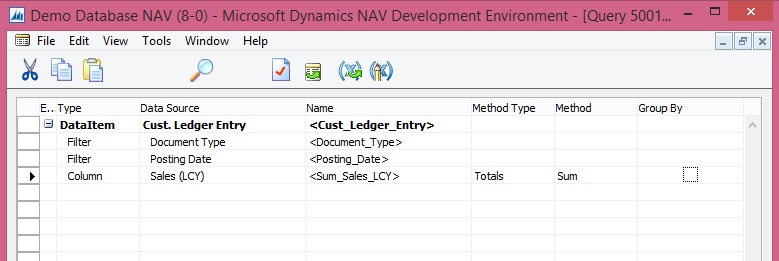
First, we will create a query object to calculate the number of open sales invoices from table 21 Cust. Ledger Entry.
Create a query for calculating the Cue data as below:
SI-Cue-2
Save the query.

Adding the Table Field for the Cue Data
Next we will add a field to the table Sales Invoice Cue (create new table) for holding the Cue data.
SI-Cue-3

SI-Cue-4
We will add a global function that returns the total amount of sales invoices for the current month from the query object that we created above procedure.

To add C/AL code to the table calculate the Cue data
Add a global function that is called CalcSalesThisMonthAmount as follows:

On the View menu, choose C/AL Globals.

On the Functions tab, in the Name column, enter CalcSalesThisMonthAmount.

Select the new function, and then in the View menu, select Properties.

Set the Local property to No.

In the C/AL Globals window, select the new function, and then choose Locals.

On the Return Value tab, set Name field to Amount and the Return Type field to Decimal.

On the Variables tab, add two variables as shown in the following table:


NameDataTypeSubtype
CustLedgerEntryRecordCust. Ledger Entry
CustLedgerEntrySalesQueryCust. Ledg. Entry Sales

In C/AL code, add the following code on the CalcSalesThisMonthAmount function:
CustLedgerEntrySales.SETRANGE(Document_Type,CustLedgerEntry."Document Type"::Invoice);

CustLedgerEntrySales.SETRANGE(Posting_Date,CALCDATE('<-CM>',WORKDATE),WORKDATE);

CustLedgerEntrySales.OPEN;

IF CustLedgerEntrySales.READ THEN

Amount := CustLedgerEntrySales.Sum_Sales_LCY;

SI-Cue-5
Save the table.

Adding the Cue to the Role Center Page
To display the Cue fields on the Role Center, We will create a new Page [PageType  = CardPart] name Sales Invoice Cue.
SI-Cue-6

SI-Cue-7
Page Designer should look similar to shown above illustration.

Open the C/AL code for the page, and then add the following code to the OnAfterGetRecord Trigger to assign the Sales This month field to the CalcSalesThisMonthAmount function of table Sales Invoice Cue:
"Sales This Month" := CalcSalesThisMonthAmount;

SI-Cue-8
Also add code to the OnOpenPage Trigger.
RESET;
IF NOT GET THEN BEGIN
INIT;
INSERT;
END;

Formatting the Cue Data
We does not want to display any decimal places. To achieve this, we set the AutoFormatType Property and AutoFormatExpr Property of the Cue field on the page. As shown above.

To change the data format

In the Properties window, set the AutoFormatType property to 10.

This enables you to create a custom data format.

Set the AutoFormatExpr property to the following text.
'<precision,0:0><standard format,0>'

<precision,0:0> specifies not to display any decimals places.

<standard format,0> specifies to format the data according to standard format 0.

Close the Properties windows, and then save and compile the page.

Run the Page created above the output should be similar to as below:
SI-Cue-9

Now you can add this CardPart Page to any of your Role Centre Page.

Monday, 17 August 2015

Using Automation to Create a Graph in Microsoft Excel

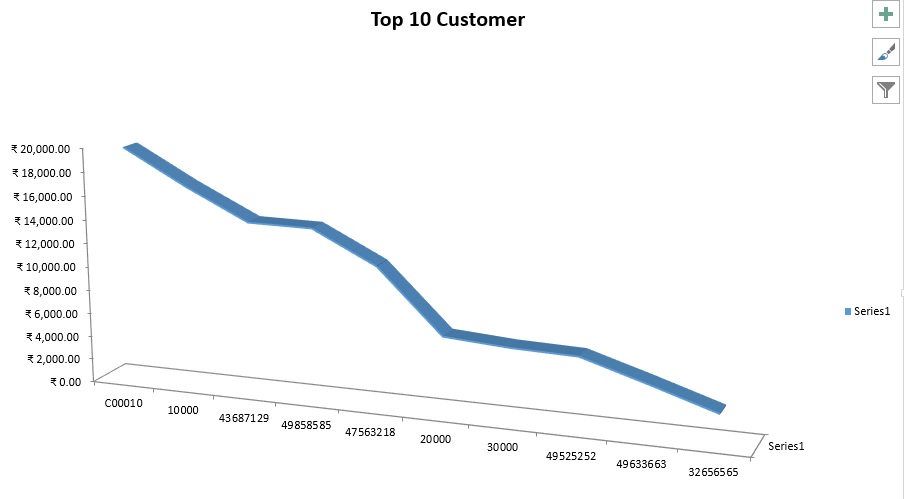
In this walkthrough, you will transfer data for top 10 Customers Sales Contribution to Microsoft Excel and create a graph.

This example shows how to handle enumerations by creating a graph in Excel that shows the distribution of Sales by Customer.

ExcelChart-1

You will run the codeunit directly from Object Designer. In a real application, you would call it from an appropriate place, such as from a menu or any other window.

About This Walkthrough

This walkthrough illustrates the following tasks:

  • Creating a codeunit that declares the Automation variables that are required for using Excel Automation.

  • Adding a function to calculate Top 10 Customers Sales Contribution.

  • Adding C/AL code to the codeunit to run the Automation object that opens Excel.

  • Adding C/AL code to the Automation codeunit to transfer data from a table record to Excel.

  • Adding C/AL code that creates a graph in Excel. 


Prerequisites 

To complete this walkthrough, you will need:

  • Microsoft Dynamics NAV 2015 with a developer license.

  • The CRONUS International Ltd. demo data company.

  • Microsoft Excel 2013 or Microsoft Excel 2010.


Creating the Codeunit and Declaring Variables

To create the codeunit and declare variables

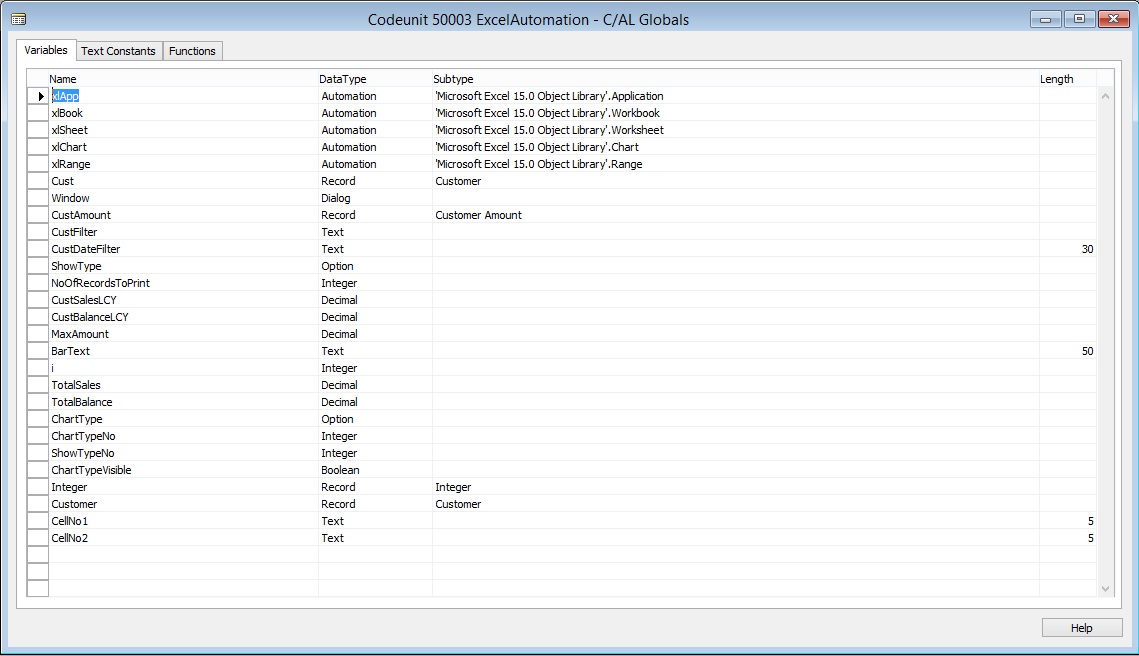
  • To implement Automation in a codeunit, you define the Automation variables. To define an Automation variable, you specify an Automation server and the Automation object.

  • The language in the regional settings of your computer matches the language version of Microsoft Excel.


  • In Object Designer, choose Codeunit, and then choose the New button to create a new codeunit.

  • On the View menu, choose C/AL Globals.

  • On the Variables tab, add the following variables:


Note

For the Automation data type variables, the subtype Microsoft Excel 15.0/14.0 Object Library defines the Automation server, and the class specifies the Automation object of the Microsoft Excel 15.0/14.0 Object Library.

ExcelChart-2


NameDataTypeSubtypeLength
xlAppAutomation'Microsoft Excel 15.0 Object Library'.Application
xlBookAutomation'Microsoft Excel 15.0 Object Library'.Workbook
xlSheetAutomation'Microsoft Excel 15.0 Object Library'.Worksheet
xlChartAutomation'Microsoft Excel 15.0 Object Library'.Chart
xlRangeAutomation'Microsoft Excel 15.0 Object Library'.Range
CustRecordCustomer
WindowDialog
CustAmountRecordCustomer Amount
CustFilterText
CustDateFilterText30
ShowTypeOption [Sales (LCY),Balance (LCY)]
NoOfRecordsToPrintInteger
CustSalesLCYDecimal
CustBalanceLCYDecimal
MaxAmountDecimal
BarTextText50
iInteger
TotalSalesDecimal
TotalBalanceDecimal
ChartTypeOption [Bar chart,Pie chart]
ChartTypeNoInteger
ShowTypeNoInteger
ChartTypeVisibleBoolean
IntegerRecordInteger
CustomerRecordCustomer
CellNo1Text5
CellNo2Text5


  • Close the C/AL Globals window.


Adding the Code

Now you add the code for the codeunit.

To add the code

  • Add a Function to calculate Top 10 Customers Sales Contribution as:


ExcelChart-3
Add code to it as:

I have not used all the values, just shown this way also you can think of while you design any such code & functions.
Window.OPEN(Text000);

i := 0;

Cust.RESET;

IF Cust.FINDSET THEN

REPEAT

Window.UPDATE(1,Cust."No.");

Cust.CALCFIELDS("Sales (LCY)","Balance (LCY)");

IF (Cust."Sales (LCY)" <> 0) OR (Cust."Balance (LCY)" <> 0) THEN

BEGIN

CustAmount.INIT;

CustAmount."Customer No." := Cust."No.";

IF ShowType = ShowType::"Sales (LCY)" THEN BEGIN

CustAmount."Amount (LCY)" := -Cust."Sales (LCY)";

CustAmount."Amount 2 (LCY)" := -Cust."Balance (LCY)";

END ELSE BEGIN

CustAmount."Amount (LCY)" := -Cust."Balance (LCY)";

CustAmount."Amount 2 (LCY)" := -Cust."Sales (LCY)";

END;

CustAmount.INSERT;

IF (NoOfRecordsToPrint = 0) OR (i < NoOfRecordsToPrint) THEN

i := i + 1

ELSE BEGIN

CustAmount.FIND('+');

CustAmount.DELETE;

END;

TotalSales += Cust."Sales (LCY)";

TotalBalance += Cust."Balance (LCY)";

ChartTypeNo := ChartType;

ShowTypeNo := ShowType;

END;

UNTIL Cust.NEXT = 0;

CustSalesLCY := Cust."Sales (LCY)";

CustBalanceLCY := Cust."Balance (LCY)";

Window.CLOSE;

IF CustAmount.FIND('-') THEN

REPEAT

CustAmount."Amount (LCY)" := -CustAmount."Amount (LCY)";

Customer.GET(CustAmount."Customer No.");

Customer.CALCFIELDS("Sales (LCY)","Balance (LCY)");

IF MaxAmount = 0 THEN

MaxAmount := CustAmount."Amount (LCY)";

CustAmount."Amount (LCY)" := -CustAmount."Amount (LCY)";

UNTIL CustAmount.NEXT = 0;


  • In the C/AL Editor, make call to above function by adding the following code to the OnRun trigger.


CustAmount.DELETEALL;

TopTenCustomer(10,ShowType::"Sales (LCY)",ChartType::"Bar chart");


  • Create an instance of Excel by adding the following code.


CREATE(xlApp, FALSE, TRUE);


  • Add a new workbook to Excel.


xlBook := xlApp.Workbooks.Add(-4167);

xlSheet:= xlApp.ActiveSheet;

xlSheet.Name := ‘Top 10 Customer';

The following describes the code:


    • In the first line, you use the Add method of the Workbooks collection to return a new workbook. The attribute -4167 is the enumerator value of worksheets as they apply to Workbook objects.

    • In the second line, you use the ActiveSheet property of the Application class to ensure that what is done next affects the active sheet of the new workbook.

    • In the third line, you use the Name property to name the sheet.


Transferring Data

To transfer the data, you must calculate the data and transfer the results of the calculation.

To transfer data

  • In the C/AL Editor, on the codeunit, use following code to transfer data of Top 10 Customers to Excel. To transfer the data to Microsoft Excel, add the following code.


CellNo1 := 'A1';

CellNo2 := 'B1';

IF CustAmount.FINDSET THEN

REPEAT

CellNo1 := INCSTR(CellNo1);

xlSheet.Range(CellNo1).Value := CustAmount."Customer No.";

CellNo2 := INCSTR(CellNo2);

xlSheet.Range(CellNo2).Value := ABS(CustAmount."Amount (LCY)");

UNTIL CustAmount.NEXT = 0;


  • The final step is to create the graph. You will use the ChartWizard method to create chart. This is a fast and simple way to do it. You can more tightly control the design of the graph by setting it up using the methods and properties of the various Chart objects, such as ChartArea and Legend.


Creating the Graph

The final step is to create the graph. You will use the ChartWizard method to create chart. This is a fast and simple way to do it. You can more tightly control the design of the graph by setting it up using the methods and properties of the various Chart objects, such as ChartArea and Legend.

To create the graph

  •   In the C/AL Editor, on the current codeunit, define a range for the data in the graph.


xlRange := xlSheet.Range('A2:'+FORMAT(CellNo2));


  • Add a new chart sheet and give it a name.xlChart.Name := ' Top 10 Customer - Graph';


xlChart := xlBook.Charts.Add;

xlChart.Name := ' Top 10 Customer - Graph';


  • Create the graph.


xlChart.ChartWizard(xlRange,-4101,7,2,1,0,1,'Top 10 Customer');

The following table describes the optional arguments that are used in the ChartWizard method.


Argument Description Value in method call
SourceThe range that contains the source data for the new chart.xlRange – The object returned by xlSheet.Range(‘A2:C3’).
GalleryThe chart type.-4101 – The enumerator for the Chart Shown above.
FormatThe option number for the built-in auto formats.7
PlotByAn integer specifying whether the data for each series is in rows or columns.2 – The enumerator for the xlRows XlRowCol enumerator.
CategoryLabelsAn integer specifying the number of rows or columns within the source range that contains category labels.1 – There is one row with category labels (the department names).
SeriesLabelsAn integer specifying the number of rows or columns within the source range that contains series labels.0 – There are no series labels in your data.
HasLegendTRUE to include a legend.1
TitleVARIANT with the title of the chart.You pass a string such as ‘Top 10 Customer’.


  • Make Excel visible by adding the following code.


xlApp.Visible := TRUE;

Excel produces a General Protection Fault error when you close a new Excel worksheet that is created when Excel is invisible. To resolve this, you can make Excel visible immediately after you create a new worksheet. You can also make Excel visible just before you create a new Excel worksheet and then make it invisible again immediately after creating the new Excel worksheet. In this case, you would add the following code.
xlApp.Visible := TRUE;

xlBook := xlApp.Workbooks.Open(FileName);

xlApp.Visible := FALSE;


  •  Clearing the Temp Table by adding the following code.


CustAmount.DELETEALL;


  • Complete code in OnRun trigger should look like below:


ExcelChart-4
Saving and Running the Codeunit

You can test the codeunit for creating the graph by running the codeunit from Object Designer.

To save and run a codeunit

  1. On the File menu, choose Save.

  2. In the Save As window, enter an ID and name, and then choose the OK

  3. In Object Designer, select the codeunit, and then choose the Run


The Microsoft Excel graph should appear. As show above in beginning of the post.

Note

If you get an error states Old format or invalid type library, then make sure that the language in the regional settings of your computer matches the language version of Microsoft Excel.

Below detailed reference to the values used in above code:

 
XlChartType


NameValueDescription
xl3DArea-40983D Area.
xl3DAreaStacked783D Stacked Area.
xl3DAreaStacked10079100% Stacked Area.
xl3DBarClustered603D Clustered Bar.
xl3DBarStacked613D Stacked Bar.
xl3DBarStacked100623D 100% Stacked Bar.
xl3DColumn-41003D Column.
xl3DColumnClustered543D Clustered Column.
xl3DColumnStacked553D Stacked Column.
xl3DColumnStacked100563D 100% Stacked Column.
xl3DLine-41013D Line.
xl3DPie-41023D Pie.
xl3DPieExploded70Exploded 3D Pie.
xlArea1Area
xlAreaStacked76Stacked Area.
xlAreaStacked10077100% Stacked Area.
xlBarClustered57Clustered Bar.
xlBarOfPie71Bar of Pie.
xlBarStacked58Stacked Bar.
xlBarStacked10059100% Stacked Bar.
xlBubble15Bubble.
xlBubble3DEffect87Bubble with 3D effects.
xlColumnClustered51Clustered Column.
xlColumnStacked52Stacked Column.
xlColumnStacked10053100% Stacked Column.
xlConeBarClustered102Clustered Cone Bar.
xlConeBarStacked103Stacked Cone Bar.
xlConeBarStacked100104100% Stacked Cone Bar.
xlConeCol1053D Cone Column.
xlConeColClustered99Clustered Cone Column.
xlConeColStacked100Stacked Cone Column.
xlConeColStacked100101100% Stacked Cone Column.
xlCylinderBarClustered95Clustered Cylinder Bar.
xlCylinderBarStacked96Stacked Cylinder Bar.
xlCylinderBarStacked10097100% Stacked Cylinder Bar.
xlCylinderCol983D Cylinder Column.
xlCylinderColClustered92Clustered Cone Column.
xlCylinderColStacked93Stacked Cone Column.
xlCylinderColStacked10094100% Stacked Cylinder Column.
xlDoughnut-4120Doughnut.
xlDoughnutExploded80Exploded Doughnut.
xlLine4Line.
xlLineMarkers65Line with Markers.
xlLineMarkersStacked66Stacked Line with Markers.
xlLineMarkersStacked10067100% Stacked Line with Markers.
xlLineStacked63Stacked Line.
xlLineStacked10064100% Stacked Line.
xlPie5Pie.
xlPieExploded69Exploded Pie.
xlPieOfPie68Pie of Pie.
xlPyramidBarClustered109Clustered Pyramid Bar.
xlPyramidBarStacked110Stacked Pyramid Bar.
xlPyramidBarStacked100111100% Stacked Pyramid Bar.
xlPyramidCol1123D Pyramid Column.
xlPyramidColClustered106Clustered Pyramid Column.
xlPyramidColStacked107Stacked Pyramid Column.
xlPyramidColStacked100108100% Stacked Pyramid Column.
xlRadar-4151Radar.
xlRadarFilled82Filled Radar.
xlRadarMarkers81Radar with Data Markers.
xlStockHLC88High-Low-Close.
xlStockOHLC89Open-High-Low-Close.
xlStockVHLC90Volume-High-Low-Close.
xlStockVOHLC91Volume-Open-High-Low-Close.
xlSurface833D Surface.
xlSurfaceTopView85Surface (Top View).
xlSurfaceTopViewWireframe86Surface (Top View wireframe).
xlSurfaceWireframe843D Surface (wireframe).
xlXYScatter-4169Scatter.
xlXYScatterLines74Scatter with Lines.
xlXYScatterLinesNoMarkers75Scatter with Lines and No Data Markers.
xlXYScatterSmooth72Scatter with Smoothed Lines.
xlXYScatterSmoothNoMarkers73Scatter with Smoothed Lines and No Data Markers.

expression .ChartWizard(Source, Gallery, Format, PlotBy, CategoryLabels, SeriesLabels, HasLegend, Title, CategoryTitle, ValueTitle, ExtraTitle)

expression A variable that represents a Chart object.

Parameters


NameRequired/OptionalData TypeDescription
SourceOptionalVariantThe range that contains the source data for the new chart. If this argument is omitted, Microsoft Excel edits the active chart sheet or the selected chart on the active worksheet.
GalleryOptionalVariantOne of the constants of XlChartType specifying the chart type.
FormatOptionalVariantThe option number for the built-in autoformats. Can be a number from 1 through 10, depending on the gallery type. If this argument is omitted, Microsoft Excel chooses a default value based on the gallery type and data source.
PlotByOptionalVariantSpecifies whether the data for each series is in rows or columns. Can be one of the following XlRowCol constants: xlRows or xlColumns. Values can be [1 or 2]
CategoryLabelsOptionalVariantAn integer specifying the number of rows or columns within the source range that contain category labels. Legal values are from 0 (zero) through one less than the maximum number of the corresponding categories or series.
SeriesLabelsOptionalVariantAn integer specifying the number of rows or columns within the source range that contain series labels. Legal values are from 0 (zero) through one less than the maximum number of the corresponding categories or series.
HasLegendOptionalVariantTrue to include a legend.
TitleOptionalVariantThe chart title text.
CategoryTitleOptionalVariantThe category axis title text.
ValueTitleOptionalVariantThe value axis title text.
ExtraTitleOptionalVariantThe series axis title for 3-D charts or the second value axis title for 2-D charts.

Remarks

If Source is omitted and either the selection isn't an embedded chart on the active worksheet or the active sheet isn't an existing chart, this method fails and an error occurs.

You can use other values from above table to create graph of your choice.

From the Microsoft Dynamics NAV Blogs: Offline web client; NAV 2015 backup and restore; Flowfield type; Defining action scope - MSDynamicsWorld.com

http://msdynamicsworld.com/story/microsoft-dynamics-nav-blogs-offline-web-client-nav-2015-backup-and-restore-flowfield-type-def


Posted from WordPress for Android

Friday, 14 August 2015

General Troubleshooting Tips

Record Locked by Another User
If you have ended Microsoft Dynamics NAV in busy mode, and then restarted Microsoft Dynamics NAV, you may experience the following error message: “Record locked by another user”. This is caused by a lock on data in a job that is still running on the server.

To release this lock, you must either shut down the SQL server manually, or restart the Microsoft Dynamics NAV Server session using the Microsoft Dynamics NAV Server Administration tool.

Sorting Actions in System Groups

In the Microsoft Dynamics NAV Windows client, you cannot order actions in system groups in the Home tab.

Remove all actions from the group, apply changes, and then add the actions again. This will ensure that metadata is created for all actions and that they can be sorted as you want.

Removing Promoted Actions in Home Tab

In Microsoft Dynamics NAV removing a promoted action in the Home tab, and then re-adding it in the same session will cause duplication of the action.

Remove the action, apply changes, add the action again, and then apply changes. Or, remove the action, add it again in same session, and then apply changes. Remove duplicate instances and apply changes.

Compression Option in IIS

Users may experience slow mobile client responses especially noticeable when they are running with a slow network connection. The reason for the mobile client running slowly can be that the dynamic compression is not enabled on the IIS server.

Configure HTTP compression of dynamic content to use bandwidth more efficiently. Enabling dynamic compression always gives you more efficient use of bandwidth, but if your server's processor utilization is already very high, the CPU load imposed by dynamic compression might make your site perform more slowly.

You can perform this procedure by using the user interface (UI), by running Appcmd.exe commands in a command-line window, by editing configuration files directly, or by writing WMI scripts.


  1. Open IIS Manager and navigate to the level you want to manage.


  2. In Features View, double-click Compression.


  3. On the Compression page, select the box next to Enable dynamic content compression.


  4. Click Apply in the Actions


The File that You Are Trying to Use Is Too Large

If you are trying to upload a large image file that is larger than 4 MB in size, such as a high-resolution photo, Microsoft Dynamics NAV will give you an error message saying that the file you are trying to upload is too large. This behavior can be changed by modifying the IIS configuration to support large file uploads.

The IIS administrator should make the following changes in the Internet Information Services (IIS) Manager.

  1. Launch the IIS Manager.

  2. In the left pane of the IIS Manager, select the Microsoft Dynamics NAV web site, and choose Request Filtering.

  3. In the Actions pane of the Request Filtering window, choose Edit Feature Settings.

  4. Set the field Maximum allowed content length (Bytes) to an appropriate value, such as 100000000 and choose the OK button.

  5. In the left pane of the IIS Manager, select the Microsoft Dynamics NAV web site, and choose Configuration Editor.

  6. In the Configuration Editor, make sure that the From field is set to Microsoft Dynamics NAV 2013 R2 Web Client Web.config

  7. Set the Section field to system.web/httpRuntime and now a number of properties will appear.

  8. Set maxRequestLength to an appropriate value, such as 100000 (kilobytes) and choose the Apply action on the right.

  9. Close the IIS Manager.


The new settings should take effect immediately without refreshing the IIS or the site.

Thursday, 13 August 2015

Bulk Inserts - in Navision 2015

By default, Microsoft Dynamics NAV automatically buffers inserts in order to send them to Microsoft SQL Server at one time.

By using bulk inserts, the number of server calls is reduced, thereby improving performance.

Bulk inserts also improve scalability by delaying the actual insert until the last possible moment in the transaction. This reduces the amount of time that tables are locked; especially tables that contain SIFT indexes.

Application developers who want to write high performance code that utilizes this feature should understand the following bulk insert constraints.

Bulk Insert Constraints

If you want to write code that uses the bulk insert functionality, you must be aware of the following constraints.

Records are sent to SQL Server when the following occurs:

  • You call COMMIT to commit the transaction.

  • You call MODIFY or DELETE on the table.

  • You call any FIND or CALC methods on the table.


Records are not buffered if any of the following conditions are met:

  • The application is using the return value from an INSERT call; for example, "IF (GLEntry.INSERT) THEN".

  • The table that you are going to insert the records into contains any of the following:

    • BLOB fields

    • Fields with the AutoIncrement property set to Yes


The following code example cannot use buffered inserts because it contains a FIND call on the GL/Entry table within the loop.
IF (JnlLine.FIND('-')) THEN BEGIN

GLEntry.LOCKTABLE;

REPEAT

IF (GLEntry.FINDLAST) THEN

GLEntry.NEXT := GLEntry."Entry No." + 1

ELSE

GLEntry.NEXT := 1;

// The FIND call will flush the buffered records.

GLEntry."Entry No." := GLEntry.NEXT ;

GLEntry.INSERT;

UNTIL (JnlLine.FIND('>') = 0)

END;

COMMIT;

If you rewrite the code, as shown in the following example, you can use buffered inserts.
IF (JnlLine.FIND('-')) THEN BEGIN

GLEntry.LOCKTABLE;

IF (GLEntry.FINDLAST) THEN

GLEntry.Next := GLEntry."Entry No." + 1

ELSE

GLEntry.Next := 1;

REPEAT

GLEntry."Entry No.":= GLEntry.Next;

GLEntry.Next := GLEntry."Entry No." + 1;

GLEntry.INSERT;

UNTIL (JnlLine.FIND('>') = 0)

END;

COMMIT;

// The inserts are performed here.

Disabling Bulk Inserts

Disabling bulk inserts can be helpful when you are troubleshooting failures that occur when inserting records. To disable bulk inserts, you set the BufferedInsertEnabled parameter in the CustomSettings.config file of the Microsoft Dynamics NAV Server to FALSE.