Showing posts with label Jet. Show all posts

Tuesday, 26 July 2016

Jet Professional 2017 - Introduction and Installation

Why to switch to and What's New in Jet Professional 2017?

Its valid question same came to my mind also when i heard about new Release.

Then i tried to explore a bit about it and got an information about some exciting features introduced with it. I will discuss as i progress with my evaluation and exploration with these features.

Here i am giving bit overview about some features and limit to Installation topic in this post. If you wish to know more you will have to wait for my next few upcomming posts.

As per Jet Report Sources:
Jet Professional 2017 makes sharing your reports easier than ever before!  

Reporting with (and without) the Jet add-in for Excel

The Jet Web Portal is an online interface that provides an easy-to-manage repository for your organization’s reports.

Using the web interface and Office 365 Online, you can allow any of your network users – whether they have Excel and the Jet add-in installed or not – to view reports directly from their web browser.

Jet Mobile for Jet Enterprise

Jet Professional integrates with the Jet Mobile web client – allowing you to log into one site to see and run all your reports - and to see all of your business intelligence dashboards.

And... Jet Mobile for Jet Enterprise includes many new features - making your dashboards more powerful and even easier to use.

What's New?

Publishing to the Jet Web Portal


The Jet ribbon within Excel includes the ability to publish your reports to the Jet Web Portal.  The Jet Web Portal provides a manageable repository for your organization’s reports. All your users – whether they have Excel and Jet Professional installed or not – can run and view reports directly from their web browser.


What is Jet Web Portal


Jet Professional 2017 represents a new way to manage, run and view your business reports. Designed for today’s always-connected, always-moving workforce, Jet Professional 2016 introduces a new Information Management System that allows business users access to their business reports using virtually any device through a simple web interface.


As a user, you don’t need to install anything to run and view reports. Within the Jet Web Portal, you can quickly find the report that you’re after, specify report parameters, run the report to get up-to-the-minute data and view it in Excel Online.


With features like sharing, search, version control and report permissions, Jet Professional 2017 is a complete report management system.


Will comeup with more detailed about new features in my upcomming posts.

Let us move to Installation part.

To get the installation file go to this link : https://www.jetreports.com/support/product-downloads/

After downloading you will get the Jet Professional Installation Files.Zip, extract it.

Install-1

Befor you start installation make sure no Excel instance is running on your system.

I am doing simple one system Instalation, will come up with more details and other options later.

Double click to Setup file to begin with installation.

Install-2

If you have Activation code enter it or you can continue and activate later.

Install-3

Select instalation type as desired, i am installing All Components.

Install-4

Select the features you want to install, since i am performing complete install, so i am accepting all as suggested by default.

Install-5

Select the Account to run the service, and don't forget to select Add rules to Windows Firewall. Rest all as default suggested.

Install-6

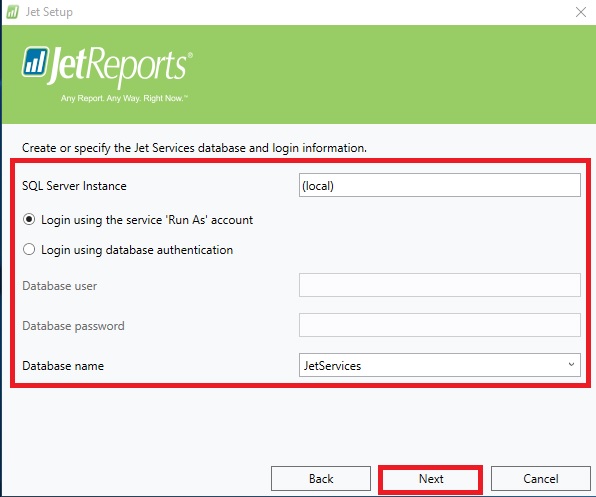
Select the SQL Instance for Jet Service Database and login method.

Install-7

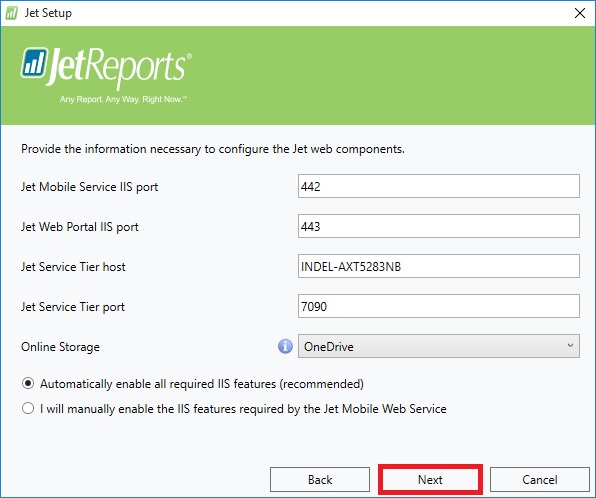
Select desired ports and host detail or accept as suggested as default.

Install-8

Enter Jet Service Tier details or accept suggested as default.

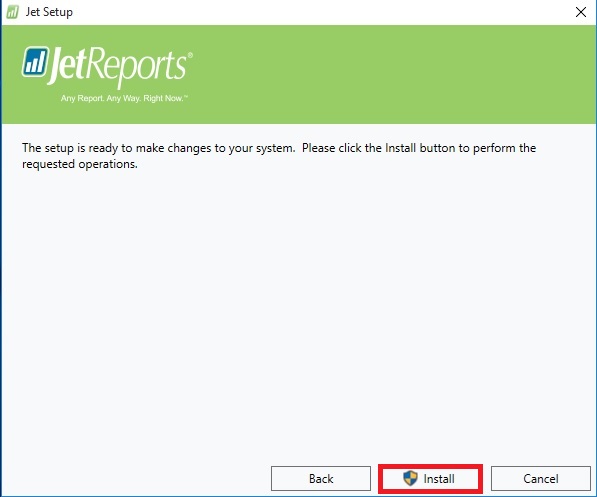
Now your pre-configuration part is completed. Click on Install to proceed with Jet Components Instalation.

Install-10

Click on Install to proceed.

Install-11

Click on Finish to exit Instalation wizard, your Jet is now installed with above provided configuration.

Install-12

Next Step is to Activate your Jet Professional.

From Jet Tab on Ribbon select Activate Jet Professional.

choose the desired option.

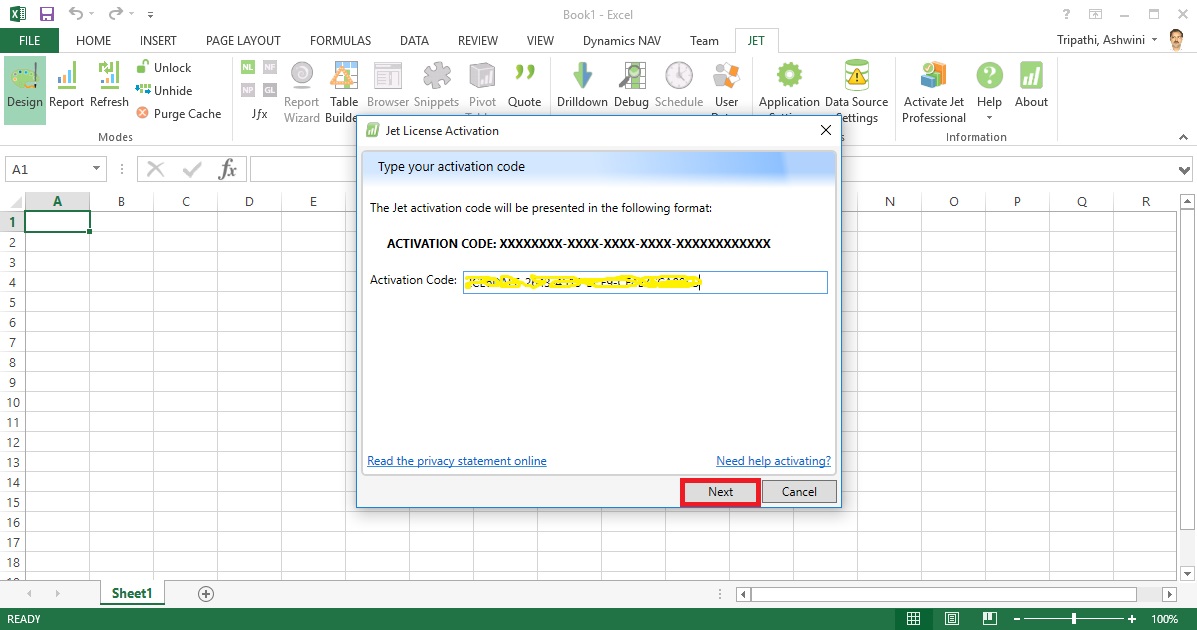
Install-13

Enter your activation code and click on Next.

Install-14

Copy the message and send to the mentioned e-mail id and click Next.

Install-15

Close to exit.

Wait for the Activation Token, it may take upto 24 hours to receive mail with this code.

Install-16

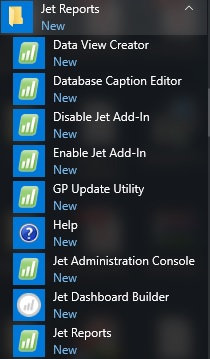
If you check your Start Menu you will find these components got installed.

Install-17

Once you receive your Tocken.

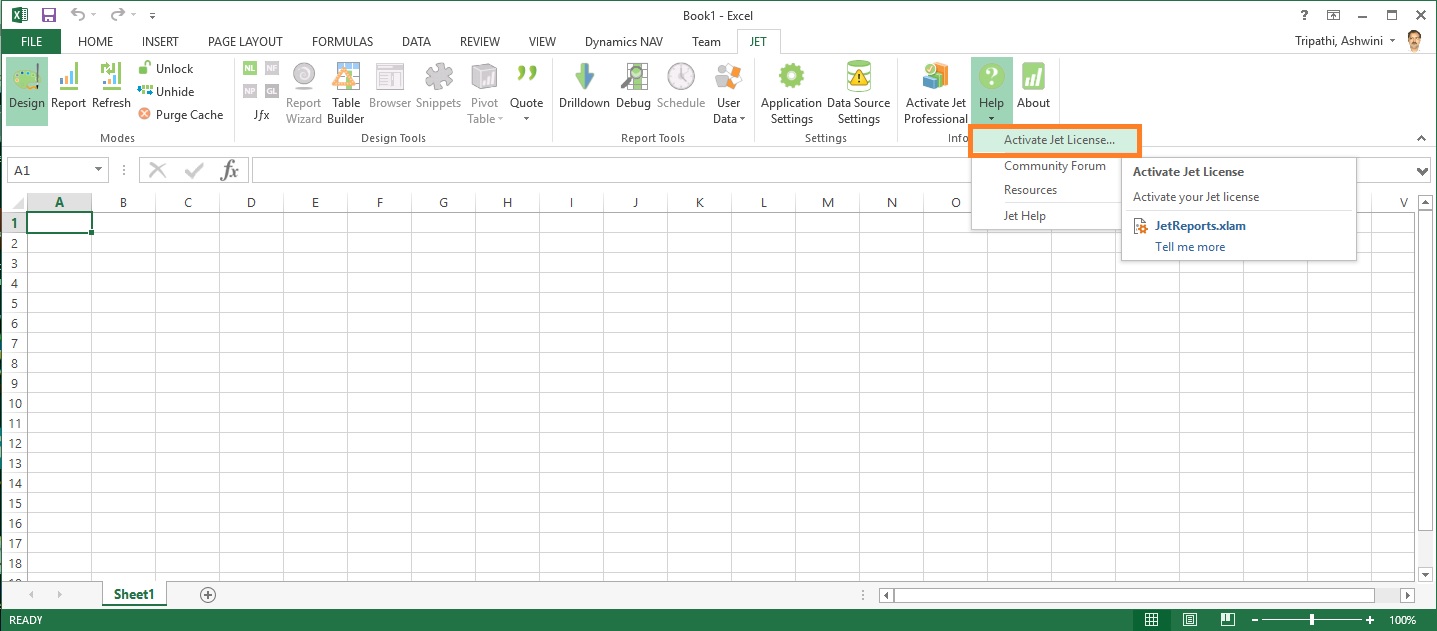
Launch Excel, From Jet Tab, Click on Help from ribbon and select Activate License.

Install-18

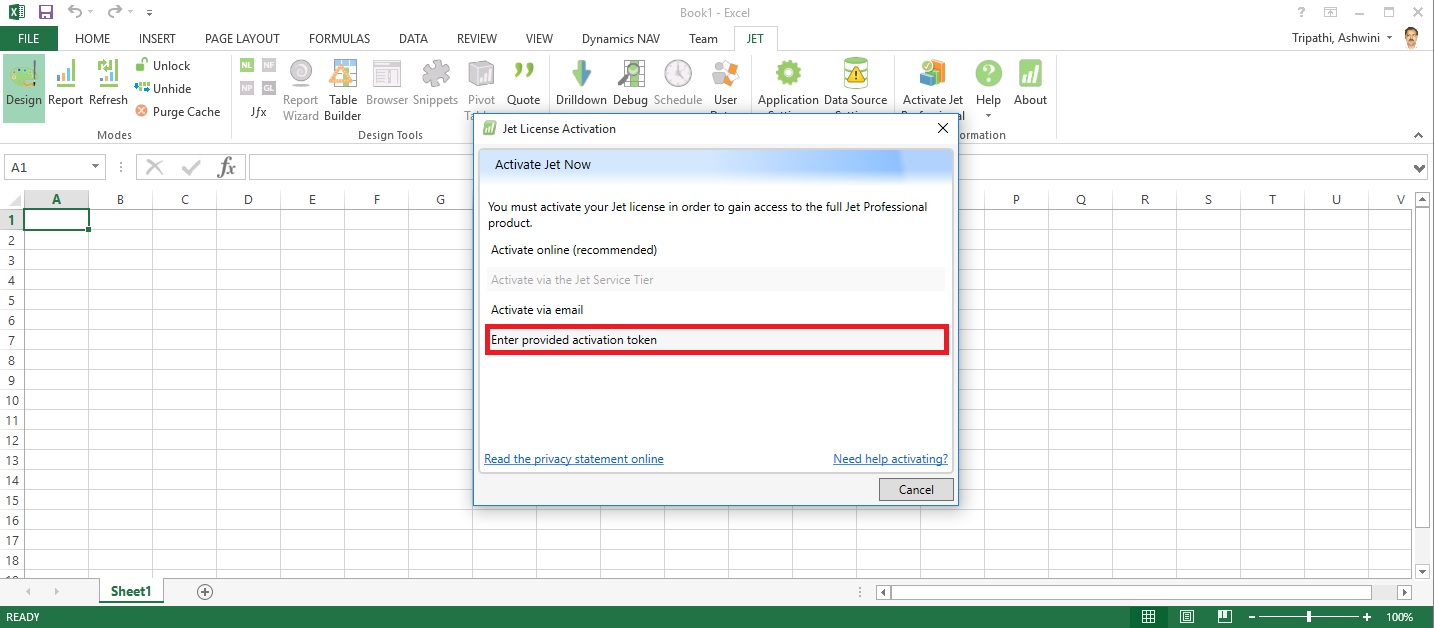
Select Enter provided Activation token.

Install-19

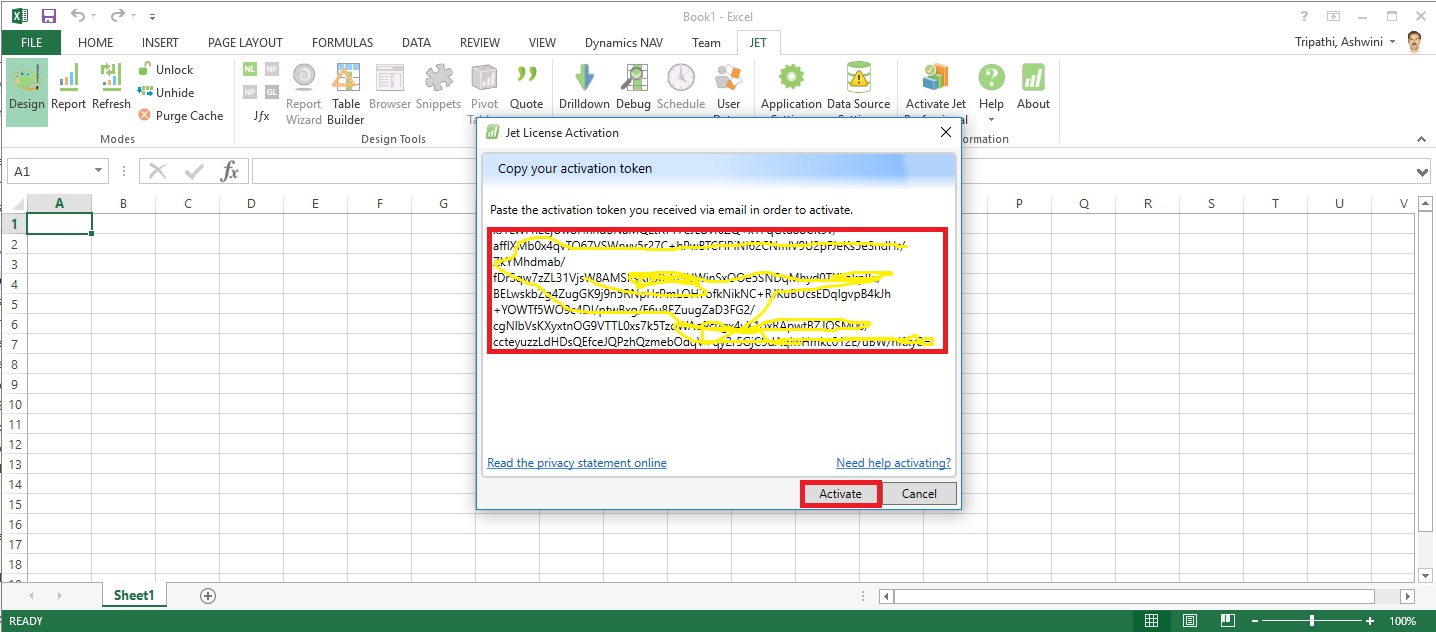
Copy the Token you received via mail here and click on Activate.

Install-20

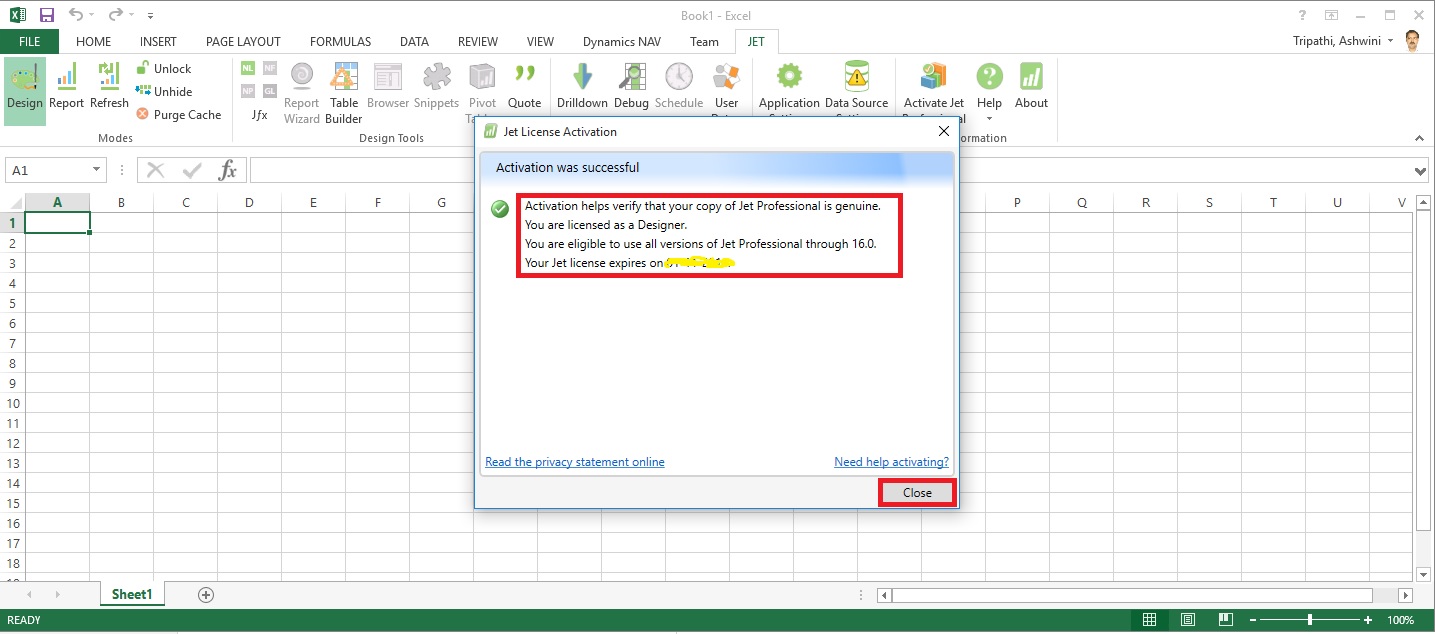
If every thing is fine you will receive the Activation Successful message.

Now you are ready to start with using Jet Professional.

I will come up with more details on this in my upcomming posts till then keep exploring and learning.


Thursday, 30 June 2016

Gaining the Competitive Advantage with BI

See how a robust business intelligence solution can help you leverage technology in order to gain new visibility on your business that will enable profitable, data-driven decisions on a daily basis.

Video-1

http://jetreports.wistia.com/medias/bkl74oqz8r?embedType=async&videoWidth=640

Video-2

http://jetreports.wistia.com/medias/yoa1upnb80?embedType=async&videoWidth=640

Wednesday, 20 April 2016

Financial Statements and Data Warehousing (Jet Reports)

Learn how a data warehouse makes creating financial statements from multiple systems fast and easy by storing all of your data in a single place that is optimized for end user reporting.

Video-1
http://jetreports.wistia.com/medias/018bcsea5n?embedType=iframe&videoWidth=640

Video-2
http://jetreports.wistia.com/medias/93wgjbfxep?embedType=iframe&videoWidth=640

Wednesday, 30 March 2016

Leveraging Business Intelligence for Ad Hoc Analysis

Leveraging Business Intelligence for Ad Hoc Analysis

Video-1

http://jetreports.wistia.com/medias/gmcjlekmpv?embedType=iframe&seo=false&videoWidth=640


Video-2

http://jetreports.wistia.com/medias/rkzi1ronom?embedType=iframe&seo=false&videoWidth=640


Friday, 25 March 2016

BI Advantage (“Reporting” and “Cubes”) Jet Reports

“Reporting” and “Cubes”: The Best of Both Worlds
Video-1

http://jetreports.wistia.com/medias/ai8jnon1nf?embedType=iframe&seo=false&videoWidth=640

Video-2

http://jetreports.wistia.com/medias/0w88iu3tg2?embedType=iframe&seo=false&videoWidth=640

BI Advantage (Account Schedules in NAV) Jet Reports

Using BI to Get the Most out of Account Schedules in NAV

Video-1

http://jetreports.wistia.com/medias/ggbxryzper?embedType=iframe&seo=false&videoWidth=640

Video-2

http://jetreports.wistia.com/medias/530rukjk1p?embedType=iframe&seo=false&videoWidth=640

BI Advantage (Reporting to Business Intelligence) Jet Reports

Graduating from Reporting to Business Intelligence

Video-1

http://jetreports.wistia.com/medias/rh3i0aunwm?embedType=iframe&seo=false&videoWidth=640

Video-2

http://jetreports.wistia.com/medias/b9xq4oj335?embedType=iframe&seo=false&videoWidth=640

BI Advantage (Web Based Dashboards ) Jet Reports

Web Based Dashboards Provide Insight from Anywhere

Video-1

http://jetreports.wistia.com/medias/9uesa3dfes?embedType=iframe&seo=false&videoWidth=640

Video-2

http://jetreports.wistia.com/medias/dbeyjnvo8t?embedType=iframe&seo=false&videoWidth=640

BI Advantage (The 5 Minute Dashboard ) Jet Reports

The 5 Minute Dashboard - It's Easier than You Think

Video-1

http://jetreports.wistia.com/medias/c9vnu6qmpb?embedType=iframe&seo=false&videoWidth=640

Video-2

http://jetreports.wistia.com/medias/pit9fq9wx0?embedType=iframe&seo=false&videoWidth=640

Sunday, 27 September 2015

Excel – Jet Report 2015 for Navision 2015

During the September month my most of the post was dedicated to Jet Reports.

There is many thing to share, which I will keep adding time to time.

For your reference here I present all the links related to this topic.

Jet Report for Excel – Navision 2015

Installing Jet Express for Excel – Navision 2015

Installing and Publishing the Jet Business Objects on the Microsoft Dynamics Server

Publishing the Jet Data Source Codeunit to the Web Service

Enable SOAP Services and identify connection parameters

Configuring a Data Source in Jet Express

Specify your Jet Interface Language

Uninstalling Jet Express

Using the Jet Ribbon Jet Essentials 2015 Update 1 for Navision 2015

Using Jet Report NL Function

Using Jet Report NF Function

Using Link in Jet Reports

Creating My First Report Using Jet Reports

Creating Simple List Report in Excel Using Jet Reports Part-1

Using NL( Lookup ) in Jet Reports Part-1

Creating Simple List Report in Excel Using Jet Reports Part-2

Using NL( Lookup ) in Jet Reports Part-2

Using NL( Lookup ) in Jet Reports Part-3

Using NP Function in Jet Reports

Using GL Function in Jet Reports

Creating Report in Jet Using NL, NF, NP & GL & Excel Formulas

Snippets in Jet Report

How to Use the Jet Report Scheduler

Other options for creating Report in Jet

Remain tuned I will be back with some other topics soon. I am just leaving this topic as of now but will keep adding more details on Jet reports time to time.

Other options for creating Report in Jet

Jet Report

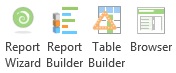
Report Wizard

An entire report can be created from a single table using the Report Wizard. The Report Wizard allows data to be grouped, filtered, sorted, subtotaled, and formated.


Report Builder

The Report Builder creates reports based on Jet Data Views.  Jet Data Views define table relationships, available fields, field captions, and table captions for a particular reporting area, such as sales, inventory, payroll, etc.  Jet Data Views can be created using the Data View Creator.

Before Using the Report Builder

Before you use the Report Builder you will need to import or create data views and categories.

A set of data views for Dynamics NAV can be found on Jet Web Site you can access the same from here. You can also click on the Download Data Views link within the Report Builder.

After downloading the file, you should open the .zip folder and extract the data view category (.jdc) file.

Importing Data Views and Categories

To import data views and categories, go to the Data Source Settings and select File -> Import -> Data View Categories.


Table Builder

An entire report can be created from a single or more table using the Report Wizard. The Table Wizard allows data to be grouped, filtered, sorted, subtotaled, and formated.


Browser

Provides browsing window to Select Tables and Fields, using which you can directly create an NL/ NF Function with their parameters and arguments.


This way I reach to end of my Jet Report Introduction Series. In future I will keep adding more details.


How to Use the Jet Report Scheduler

Overview

The Jet Scheduler is a powerful tool that allows users to schedule reports to be automatically run by the Windows Task Scheduler. The user can also control where the output file is saved to, if the report should be emailed once it has been generated, and the output format of the report.

Creating a New Scheduled Task

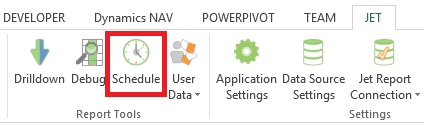
To set up a scheduled report, open the report in Excel, click the Jet ribbon, and click the Schedule button.

JetSchedule-1

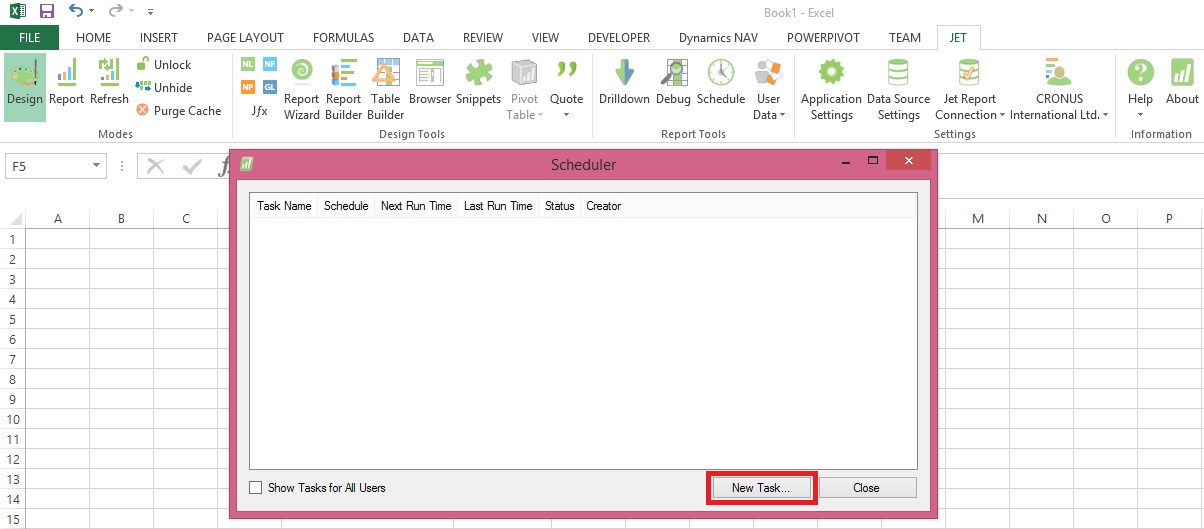
Click the New Task... button to schedule a new task.

JetSchedule-2

The Scheduled Task window will now appear.

Reports Tab

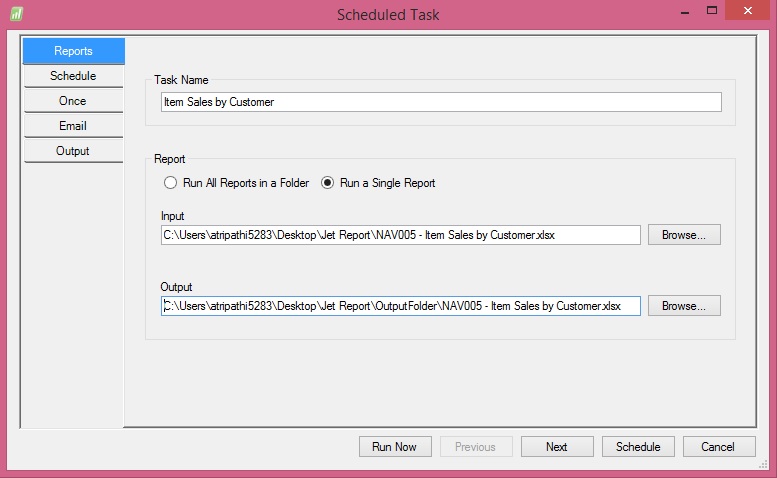
JetSchedule-3

The Reports tab contains general information about the scheduled task.

  • Task Name: This represents the name of the task as it will appear in the Scheduled Task window to the user.

  • Run All Reports in a Folder: This button will enable the user to schedule all Jet Reports in a full to be run

  • Run a Single Report: This button will enable the user to schedule a single Jet Report to be run

  • Input: This represents the folder and file name of the report that will be run

  • Output: This represents the folder and file name of where the finished report will be saved


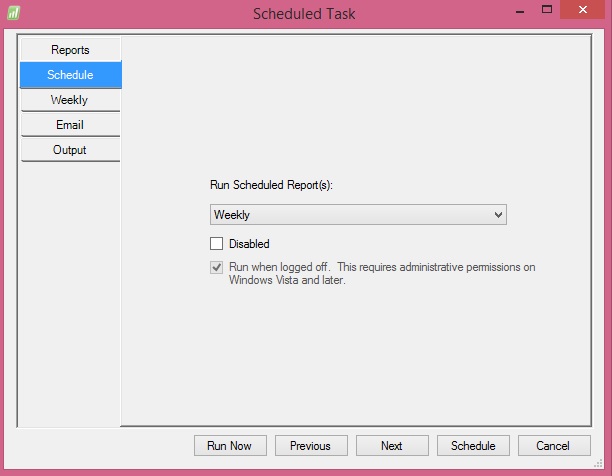
Schedule Tab

JetSchedule-4

This tab will define the frequency of how often the report will be run as well as if the task is currently disabled and if the report should be run when the user is logged off.

The available options for the frequency are:

  • Once: The report will only be run one time

  • Daily: The report will be run every day (it is possible to set on the next tab the number of days to wait between runs)

  • Weekly: The report will be run every week (it is possible to set on the next tab the days of the week for the report to be run on)

  • Monthly: The report will be run every month (it is possible to set on the next tab the months for the report to run on and the days of the month for the report to be run on)

  • When Idle: The report will run every time that the computer goes into idle mode

  • At Startup: The report will be run each time that the computer is turned on

  • At Logon: The report will be run each time that the user logs on to the computer


Frequency Tab

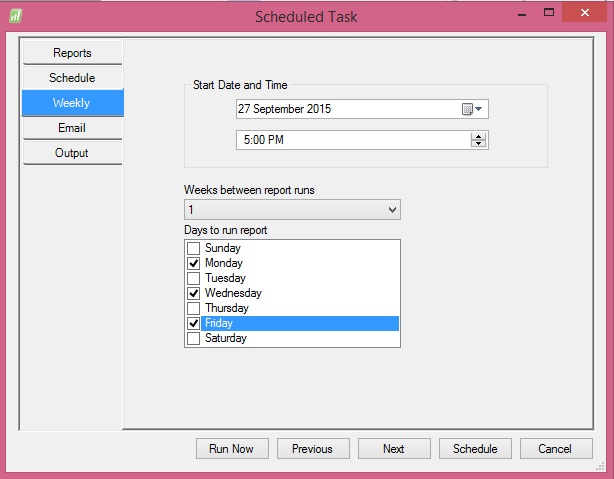
JetSchedule-5

The name of this tab will change depending on the frequency specified on the Schedule tab.

In the screenshot above a Weekly frequency has been specified.

  • Start Date and Time: This represents the first date that the report will run and the time that it will run for this and subsequent schedules

  • Weeks between report runs: This specifies how many weeks the Scheduler will wait between report runs before running the report again

  • Days to run report: This represents the days of the week that the report is scheduled to run on


Email Tab
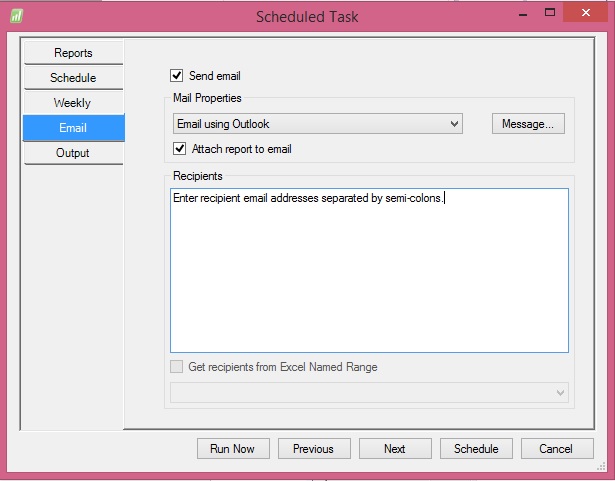
JetSchedule-6
The Email tab allows the user to define who the report will be sent to if emailing is desired.

  • Send email: If this box is checked it will enable the report to be emailed to recipients

  • Mail properties: This dropdown will allow the user to specify whether the report will be emailed using Outlook or a generic SMTP protocol. SMTP must be configured in the Jet Essentials Application Settings in order for it to be used.

  • Message: This allows the user to specify a custom subject or body to be sent as part of the email

  • Attach report to email: If this box is checked the report will be attached to the email. If the box is unchecked the report will not be attached. This can be used as a type of notification when used in conjunction with the subject and body of the email to allow a user to know that the report has been run

  • Recipients: Email addresses will be specified here for all recipients of the report. Email addresses should be separated by a semi-colon.

  • Get recipients from Excel Named Range: It is possible to also define the email addresses in the report itself and then assign an Excel named range to the cell(s). If there are named ranges in the report then they will appear in the dropdown below the checkbox. The Output tab allows the user to define how the file should be saved once it is finished running. This tab also enabled the user to turn on logging to troubleshoot errors with the Scheduler process as well as use Batch File Generation for the reports.


Output Tab
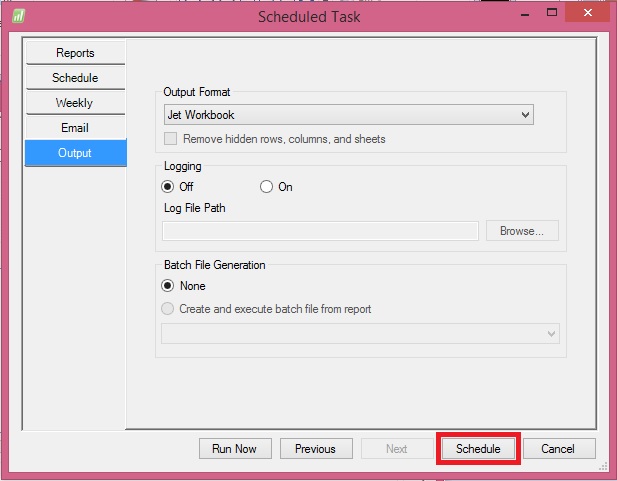
The Output tab allows the user to define how the file should be saved once it is finished running. This tab also enabled the user to turn on logging to troubleshoot errors with the Scheduler process as well as use Batch File Generation for the reports.

JetSchedule-7

  • Output Format: This dropdown list will allow the user to define the format of the finished report. The available options are:

    • Jet Workbook: This will save the report as a normal Excel file with all Jet Reports functions still in the report

    • Values Only Workbook: This will save the report as an Excel file with all Jet Reports functions removed. The recipient would not be able to refresh the report as it will be a static Excel file

    • Web Page: This will save the report as a HTML file with a single sheet. This should be used when there is a single sheet in the report

    • Web Page by Sheet: This will save the report as a HTML file with multiple sheets embedded in it. This should be used when there are multiple sheets in a report

    • PDF: This will save the report as a PDF file (if your version of Excel supports that ability - Excel 2007 and higher)


Remain tuned for more details, I will come up with more details and features in my upcoming posts.

Snippets in Jet Report

Snippets are small, reusable report parts that can be shared between Jet users.

Configuring the Snippet Folder and Sharing Snippets

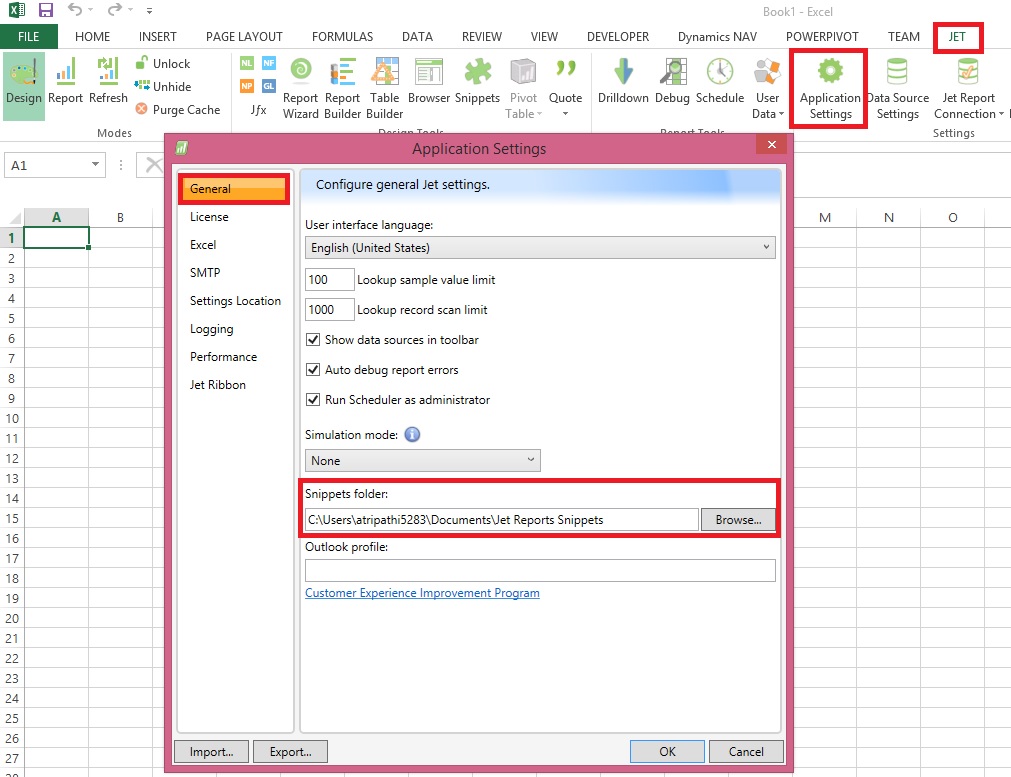
Snippets are stored in the "Jet Reports Snippets" folder located in your My Documents directory.

This location can be changed in the Application Settings.  Each snippet is stored in a *.snippet file.  To share snippets, copy the snippet files from one user's snippet directory to another's.  Close and open the Snippets window and the newly added snippets will become available.

Snippet-1

Creating and Using a Snippet

Creating a Snippet

To create a snippet, open the Snippet tool.  Highlight the range of cells containing the piece of functionality for which to make a snippet.  Then, click the New Snippet button in the Snippet tool.

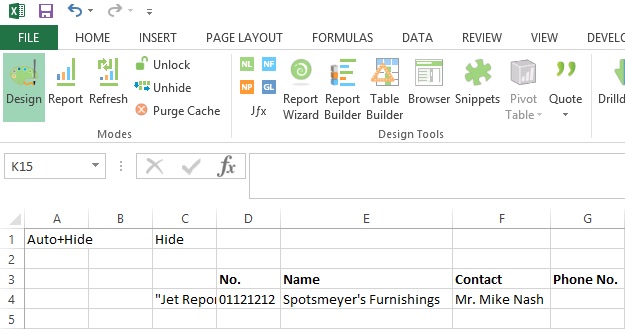
I have created a simple Report for Active Customers, which Lists all the customers where Blocked = ‘’

Snippet-2

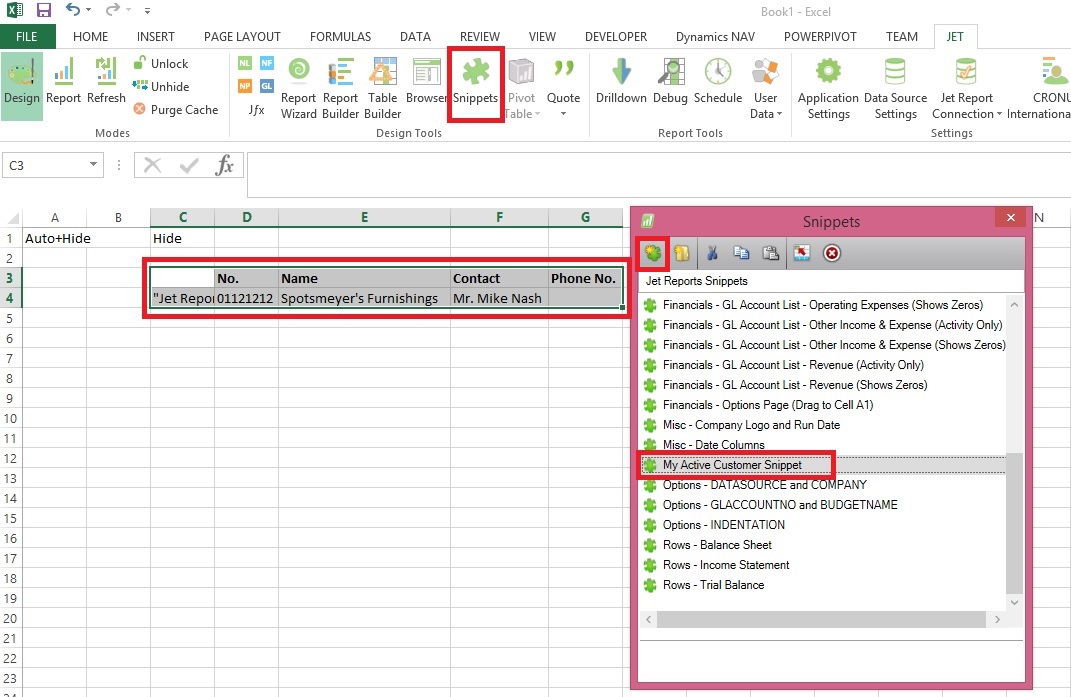
We want to save this as a snipped so that any user can reuse it if required.

Snippet-3

  • Click the Snippet Button

  • Select the range of cells you want to save as snippet.

  • In Snippet Window click the New Snippet

  • Give the meaningful name to your Snippet.


Using a Snippet

To use a snippet, drag and drop it from the Snippets window to any cell of your workbook.  Any existing Excel formulas, text, or formatting in these cells will be overwritten.

Rename

You can rename a snippet by selecting it and pressing F2 or by right-clicking it and selecting Rename.

Delete

Delete a snippet by selecting it and then pressing the Delete button in the Snippet tool or by pressing the delete key.

Replace

You can replace the contents of the current snippet by selecting the region of the worksheet that you would like to use as the contents, selecting the snippet you wish to replace in the Snippet tool then pressing the Replace button.

Organizing Snippets

Snippets are organized in a folder structure.  Snippets can be organized into folders using drag and drop or cut/copy/paste within the Snippet tool.

Will come up with more information and other features.

Saturday, 26 September 2015

Using GL Function in Jet Reports

Syntax: =GL (What,Arg1,Arg2,Arg3,..,Arg22)

Purpose: Returns the budget, balance, net change, quantity, debits or credits of the G/L Account of a given company based on filters.


Dynamics NAV ParameterDescription
 WhatNAV: Determines what the GL Function returns. Options are Balance, Budget, Quantity, Credits or Debits Note that the options available for the What argument depend on the Where argument.
 AccountNAV: G/L Account Number, Filter or Range. If you specify a single, totaling account, you will get totals. If you specify multiple accounts or a range of accounts, totaling accounts will not be included in the returned number even if the other account(s) have nothing to do with the specified totaling account(s). If the Where argument is "Rows", "Columns", or "Sheets", then the What options are "Accounts" which will give a list of account numbers, "Categories" which will give a list of account category numbers, or "SegX" where X is a segment number and which gives a list of that specific account segment.
StartDateNAV: Specifies the starting date of transactions to include. If you are interested in the balance of an account on a given date, leave StartDate blank. If you are interested in the net change of an account, use Balance and specify both the StartDate and EndDate
 EndDateNAV: Specifies the ending date of transactions to include. Specifying a start period and an end period will give you the net change between the first day of the start period and the last day of the end period. Specifying a start period with no end period will give you the net change between that start date and the present. Specifying no start period will give you the balance/budget as of the end period. Specifying no start period or end period will give you the present balance/budget.
 ViewNAV: The G/L Analysis View to use. Leave this blank to use balances from the G/L directly. Analysis Views are available in Navision version 3 and later. This field should be blank if you are using objects from an earlier version of Navision.
 Dim1NAV: Filter for the first dimension of the analysis view. If View is blank, this is the filter for Global Dimension 1. Dimension totaling is handled the same way as Account totaling. In Navision versions before 3.0, Dim1 is used as the Department filter.
 Dim2NAV: Filter for the second dimension of the analysis view. If View is blank, this is the filter for Global Dimension 2. In versions before 3, this is the Project filter.
 Dim3NAV: Filter for the third dimension of the analysis view.
 Dim4NAV: Filter for the fourth dimension of the analysis view.
 BusinessUnitNAV: Filter for the business unit.
 BudgetNAV: Budget filter. This is unused unless returning budgets.
 CompanyNAV: Company Name. This must be spelled the same as it appears in Navision, including case, spaces and punctuation. If this parameter is empty (""), the default company in the Jet Reports Options/Data Sources Screen is used.
 ReservedNAV: Blank. For backwards compatibility, a Data Source Name as defined in Jet/Options can be used.
 ReservedGP: Specifies filters for specific account segments. You can use either an account argument or segment filters, not both.
 ReservedGP: Specifies filters for specific account segments. You can use either an account argument or segment filters, not both.
 Reserved  GP: Specifies filters for specific account segments. You can use either an account argument or segment filters, not both.
 ReservedGP: Specifies the budget filter, blank for all budgets. Note that budgets are associated with a specific year in Great Plains so if your budget and fiscal year filters do not coincide you will get a 0 value.
 ExcludeCloseNAV: “True” to exclude closing date transactions. Defaults to “False”.
 ShowQueryNAV: "True" to show the finhlink string that will be used for drilldown. Defaults to "False".
 ReservedGP: Company name. If this parameter is blank, the default company is used.
 Data SourceData source name. If this parameter is blank, the default data source is used.

Reports based on the G/L are easy with the GL function.

=GL(What, Account, StartDate, EndDate, View, Dim1, Dim2, Dim3, Dim4, BusinessUnit, Company, Reserved, ExcludeClose, Reserved, Reserved, Reserved, Reserved, Reserved, Reserved, ShowQuery, Reserved, DataSource)

NAV Cronus Examples

To retrieve the balance of G/L account 44100, you would type the following.

=GL("Balance","44100")

If you wanted to know the net change of account 44100 between 1/1/2002 and 1/31/2002, you would type the following.

=GL("Balance","44100","1/1/02","1/31/02")

For G/L Balances with standard NAV:

  • you can filter on the two Global Dimensions for G/L Balances or

  • if using a NAV Analysis View, you can filter on up to 4 dimensions that are tied to that View=GL("Balance","40100",,,,"USA","COPPER") 

  • Please note that some NAV verticals that allow more than 2 Global Dimensions may not be compatible with the GL function. 

  • For the balance of account "40100" with Global Dimension 1 of "USA" and Global Dim 2 of "COPPER", you can use the following function.


Stay tuned for how to use GL Function in Jet Reports.

I will come up with more details on this in my upcoming posts.

Using NP Function in Jet Reports

Syntax: =NP (What, Arg1, Arg2,...,Arg22)

Purpose: Does various utility functions documented below.

Let’s see what options are available in below table:


WhatDescription/Parameter
"Eval"Evaluate the formula in the Arg1 parameter. The formula must be enclosed in quotes and will be evaluated when the report refreshes.
"DateFilter"Calculates a date filter using the start date and end date specified in the Arg1 and Arg2 parameters.
"Union"Returns (in the form of a Jet-specific list) the Union of two arrays specified in the Arg1 and Arg2 parameters. Note that in versions of Jet Essentials 2015 and earlier, if NP("Union") is by itself in a cell, it will only return the first value from the array. For those versions, you must put it inside an NL("Rows") in order to correctly return all the data.
"Integers"Returns a string that can be used to generate integers using a Replicator, where Arg1 is the start number and Arg2 is the end number.
"Intersect"Returns (in the form of a Jet-specific list) the intersection of two arrays specified in the Arg1 and Arg2 parameters. Note that in versions of Jet Essentials 2015 and earlier, if NP("Intersect") is by itself in a cell, it will only return the first value from the array. For those versions, you must put it inside an NL("Rows") in order to correctly return all the data.
"Difference"Returns (in the form of a Jet-specific list) the difference of two arrays specified in the Arg1 and Arg2 parameters. Note that if NP("Difference") is by itself in a cell, it will only return the first value from the array. You must put it inside an NL("Rows") in order to correctly return all the data.
"Format"Formats an expression with a specific Excel formatting string.  Arg1 is the expression to format such as a date or cell reference, and Arg2 is the Excel formatting string such as "YYYY/MM/DD" for a date formatted with a 4-digit year then a 2-digit month and 2-digit day.
"Join"Joins the elements of the array specified in Arg1 together into a single string separated by the contents of Arg2.
"Split"In versions of Jet Essentials 2015 Update 1 and higher, this function splits the string in Arg1 into a Jet-specific list.
In earlier versions of Jet Essentials, this function splits the string in Arg1 into an array of values. The splitting is delimited by the contents of Arg2. Note that if NP("Split") is by itself in a cell, it will only return the first value from the array. You must put it inside an NL("Rows") in order to correctly return all the data.
"Codeunit"Evaluates and returns the value returned by the Dynamics NAV code unit function.
"Companies"Returns a list of the companies associated with a data source. Arg1 is a company filter such as A* to return all companies that start with the letter A. Leaving Arg1 blank will return all companies. Arg2 is the data source. Leaving Arg2 blank will return companies from the current data source. Note that you should reference the result of this function in the table argument of an NL replicator function to actually list them out in Excel.
"Dates"Returns a string that can be used to generate dates using a Replicator, where:
Arg1 is the start date
Arg2 is the end date.
Arg3 can be used to specify a period type of Day, Week, Month, Quarter, or Year.  Default is Day.
Arg4 can be set to "True" in order to return the end of each period.  Default is "False".
"DataSources"Returns an array containing the current user's Jet data sources.
"Formula"Evaluates the Excel formula contained within Arg1.
"Slicer"Returns an Excel Slicer in Arg1 that can be used as a filter in Jet functions when using a Cube data source.

EVAL

To increase performance, you can reduce cross-sheet references. The following NP evaluates the formula in cell of D5 from a worksheet called Options. =NP("Eval","=Options!$D$5")

This function is executed once on refreshing the report, rather than for every cell update. =NP("Eval","=Today()")

Performance can also be increased by not using volatile functions.

DATEFILTER

Results of using the NP(DateFilter) function, which can then be nested in other functions.
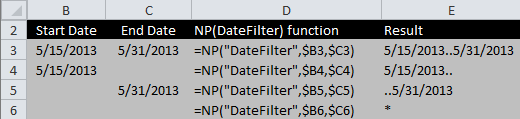
NP-1
INTEGERS

This NP(Integers) function will create rows with the numbers 1 through 10. =NL("Rows",NP("Integers",1,10))

JOIN

The following NP(Join) joins the strings from an array and creates the result "100|200|300|400" for potential use in another function. =NP("Join",{"100","200","300","400"},"|")

SPLIT

The following NP(Split) splits up the string "this|is|an|array" and creates the array {this, is, an, array}. =NP("Split", "this|is|an|array", "|")

COMPANIES

The following NP(Companies) function lists all the companies for the current data source in rows. =NL("Rows",NP("Companies"))

DATES

The use of NP(Dates) to create a set of column headers for a report. (Dates can also be placed in reverse order by putting the later date in first)

NP-2
DATASOURCES

This NP(DataSources) function will return a list of the data sources in use on the machine it is run on. =NL("Rows",NP("Datasources"))

FORMULA

Used in conjunction with the NL(Table) function to define a calculated column in the table definition. For example: To determine available credit for a customer; if cell E6 contains the credit limit, and cell F6 contains the open credit, then =NP("Formula","=E6-F6") would be put in the field list of the NL(Table) definition

SLICER

The Slicer function works in conjunction with pivot tables and dashboards to provide information for filters when refreshing reports.
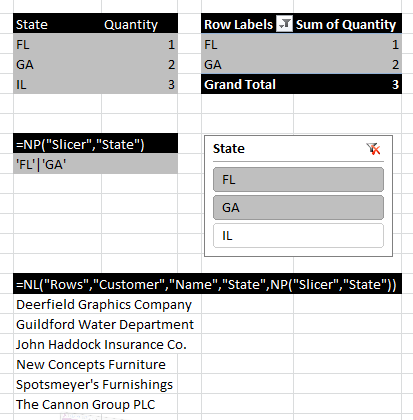
NP-3
Array Calculations

Arrays are lists of data values. You can obtain a string representing such a list from Jet using "Filter" as the What parameter in an NL function. The values in arrays returned by Jet are guaranteed to be unique. The resulting array might be a list of Customers or a list of Invoice Document numbers or any other list of data that match a set of filters. The array calculation operations of the NP function allow you to find different combinations of two arrays.

An example of when you would need an array calculation is listing the invoice document numbers where either the Type on an Invoice Line is "Item" for all item numbers, or the Type is "G/L Account" and the account number is 300. Both the Item numbers and the G/L Account numbers are stored in the same "No." field, so there is no single set of filters that will create this list of document numbers.

The array operations available in the NP function are "Difference", "Union" and "Intersect". The difference between two arrays consists of all of the elements that are in the first array but are not in the second. The union of two arrays consists of a single copy of all of the elements in both arrays with any duplicates eliminated. The intersection of two arrays is the set of elements that are common to both arrays. An example of the results of the array operations are listed in the table below.


Array 1 {100, 200, 300, 400, 500}Array 2 {400, 500, 900, 1000, 2000}
Difference{100, 200, 300}
Union{100, 200, 300, 400, 500, 900, 1000, 2000}
Intersect{400, 500}

=NL("Rows", NP("Union", NL("Filter","Customer","No.","Name","A*"), NL("Filter","Customer","No.","Name","B*")))

=NL("Rows","Customer","No.","Name","A*|B*")

The following formula creates a list down rows of the document numbers of all invoices where either the Type field is "Item", or it is "G/L Account" and the No. field is 2000.

=NL("Rows", NP("Union", NL("Filter","Sales Invoice Line","Document No.","Type","Item"), NL("Filter","Sales Invoice Line","Document No.","Type","G/L Account","No.","2000")))

You should be cautious using arrays because they are often not the easiest or fastest way to solve a problem. Example 1 is a good example of a query that does not require arrays, and will run much slower if you use them. Also remember that, with Jet Essentials 2015 and earlier, if NP("Union"), NP("Intersect"), or NP("Difference") are by themselves in a cell they will only return the first value from the array. You must put them inside NL("Rows") as in the examples above in order to correctly return all the data.

There are two more array operations that behave a bit differently than those listed above: "Split" and "Join". "Split" takes two text strings and splits the first string based on the second, resulting in an array. For instance, if you wanted to create a list of account numbers based on the string "1000+2000+3000", the formula would look like the following.

=NP("Split","1000+2000+3000","+")

The result would be the array {"1000","2000","3000"}. Note that this must be put inside an NL("Rows") as in the Union examples above in order to return all the data.

In the opposite scenario, if you have an array but would like to create a text string by joining each element of that array separated by a given string, you would use the "Join" operation. Using the same array, you can create a string for a filter with array values separated by the "|" character with the following formula.

=NP("Join",{"1000","2000","3000"},"|")

The result would be the text string "1000|2000|3000", which is a valid filter that you could pass into an NL function.

For Join and Split, Arg1 of the NP function is the value you want to manipulate and Arg2 is the character by which you want to join or split the value. If you experiment with these operations, you will find that you have an amazing amount of flexibility, especially when you use them in conjunction with the other array calculation formulas listed above.

Please note that the results of an NP("Join") may be very large and thus putting it directly inside another function may cause problems with Excels 256 character formula limit as in the following formula.

=NL("Rows",NP("Split",NP("Join",{"some","array","here"},"|"),"|"))

It is recommended that in a situation like this the NP("Join") be placed in a separate cell as in the following.

B2: =NP("Join",{"some","array","here"},"|")

B3: =NL("Rows",NP("Split",B2,"|"),"|"))

Stay tuned for usage of NP functions in Jet Reports.

I will come up with more details in my upcoming posts.

Friday, 25 September 2015

Using NL( Lookup ) in Jet Reports Part-3

We have discussed regarding Lookup in my previous post. If you missed can find link here.

Using NL( Lookup ) in Jet Reports Part-1.

Using NL( Lookup ) in Jet Reports Part-2.

Continuing with more advanced usage I am here below.

Another useful feature of the NL(“Lookup”) function is the ability to specify how many records Jet Reports will go through in order to create a list of values.

By default, Jet Reports uses the value that is set for Maximum Lookup Records Scanned on the Jet Reports Options form. The default is 1,000 records. If the number of desired records to be searched is larger than this setting, the “ScanLimit=” keyword can be utilized.

To apply a scan limit, “ScanLimit=” must be placed in one of the FilterField parameters and then the desired number of records to be searched will be placed in the associated Filter parameter.

To create a Lookup function that will return all of the G/L Account Numbers in the first 5,000 records of a G/L transaction table, the function would look like this:
=NL(“Lookup”,”G/L Entry”,”G/L Account No.”,”ScanLimit=”,”5000”)

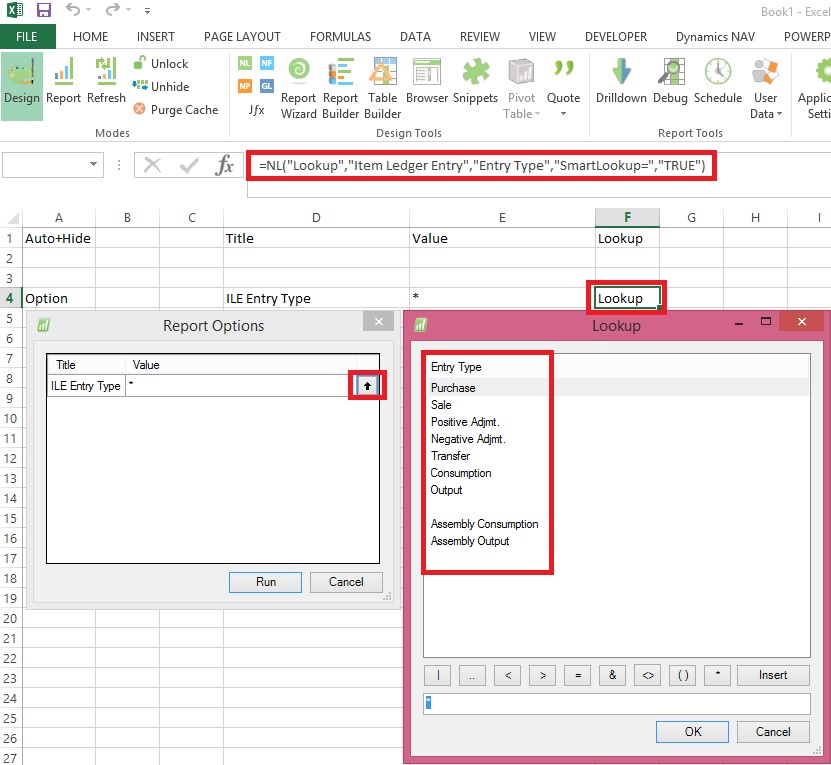
The NL("Lookup") function normally returns all values (for the particular field) that are present in the table specified.  For fields defined in NAV as "Option" fields, it may sometimes be desirable to display *all possible* value - regardless as to whether those values are present in the table or not.  For this, a useful feature is the "SmartLookup=" option (available in Jet Essentials 2012 R2 and later).

For example, the function:
=NL("Lookup","Item Ledger Entry","Entry Type")

Might provide a Lookup window that may not list all options depending upon data in the table.

By adding the "SmartLookup" option we could get a list of all options defined as option to that field.
 =NL("Lookup","Item Ledger Entry","Entry Type","SmartLookup=","TRUE")

Lookup-10

Stay tuned for more details in my upcoming posts

Using NL( Lookup ) in Jet Reports Part-2

We have discussed regarding Lookup in my previous post. If you missed can find link here.

Using NL( Lookup ) in Jet Reports Part-1.

I am continuing with more advanced usage here below.

In some instances it is also desirable to base the values that are displayed in one NL(“Lookup”) function on the results that were selected in another NL(“Lookup”) function.

An example of this could exist in a Sales Report. The viewer will have the ability to select a Salesperson Code to run the report for, and will also be able to specify Customer Numbers in order to filter the report further.

If only one Salesperson Code is selected, however, it may be undesirable to display Customer Numbers that are associated with other Salesperson Codes.

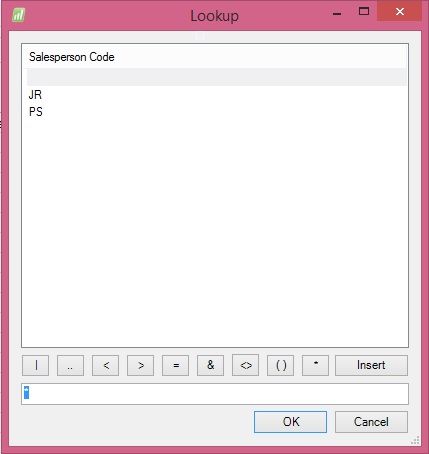
In this instance, two NL(“Lookup”) functions will be used, with the Customer Number filtered by the Salesperson Code so that the values are related. The first NL(“Lookup”) function, which will allow the selection of the Salesperson Code, will look like this:
Lookup-6

Lookup-7

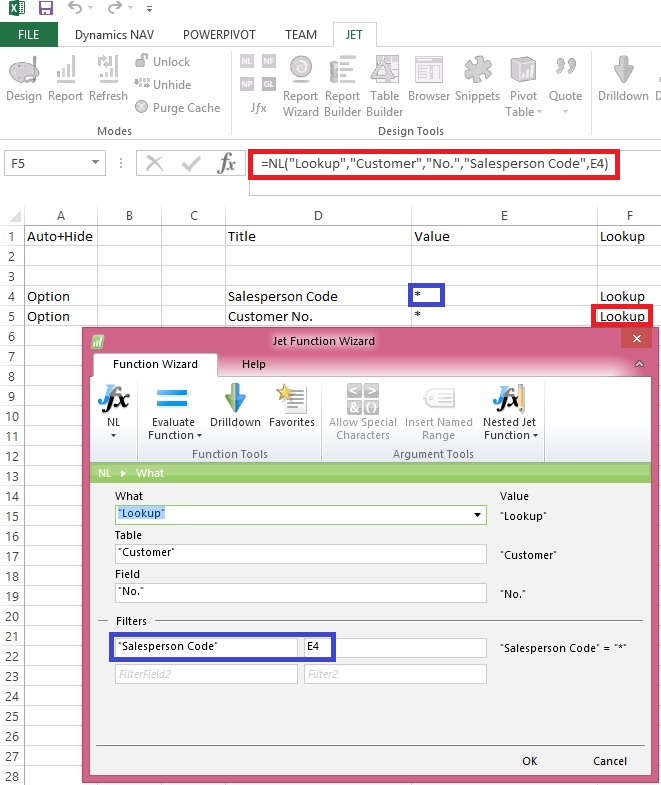
The next NL(“Lookup”) function will give the viewer the ability to select from a list of Customer Numbers, but it will be filtered based on the Salesperson Code that was previously selected. This is done but inserting a normal filter into the function and referencing the cell containing the Salesperson Code that was previously selected by the viewer.

This addition would make the report look like this:
Lookup-8
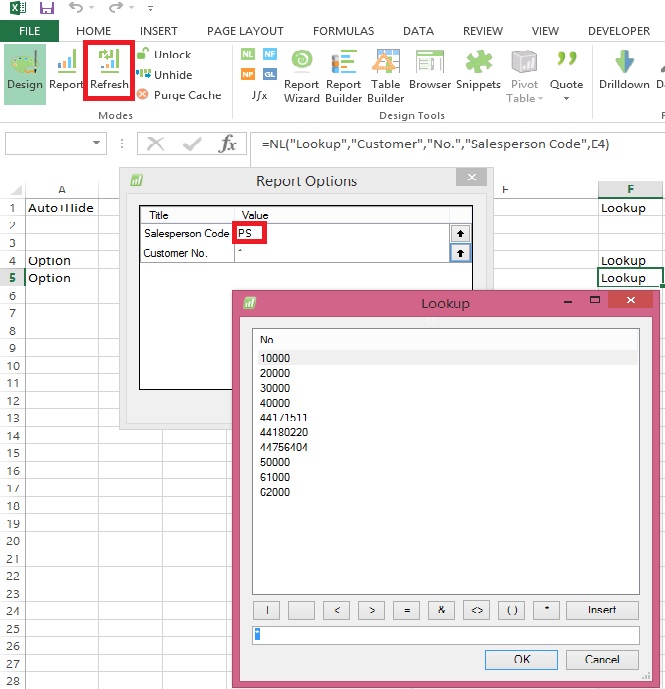
After selecting Salesperson Code Filter when we open Customer List it will show lookup as below:
Lookup-9

Customer List is filtered out with Salesperson Code we selected using Salesperson List Lookup.

Will come up with more details in my upcoming post, stay tuned for more details.

Creating Simple List Report in Excel Using Jet Reports Part-2

In my previous post we saw how to create simple report in excel using Jet Report.

If not seen please refer it before you continue with this post, here is the link for same:

Creating Simple List Report in Excel Using Jet Reports Part-1

Using NL Lookup Part-1

Here we will start from where we left in previous post.

We will add one more sheet in Report we created in our previous post, and name it is as Option, where we will define all of our Filters.

Our Option sheet will look as below:
JetSimpleReport-7
Here we have created 3 Filters Customer No., Credit Limit LCY & Balance LCY.

Next Step will be to apply this Filter provided by user at runtime to the Report.

Return to your Report Sheet and edit the NL Function used to retrieve Rows from Customer as below:
JetSimpleReport-8
(*) in filter denotes all, in other words no Filter.

Now let see the Filter Sheet how it behaves when we run the report.

When we run the report first Report option is shown, where we will give our Filters:
JetSimpleReport-9

Here I am giving below filters:
Customer No. Filter                         *              Include All Customers

Credit Limit (LCY) Filter                  0              All rows with Credit Limit as Zero

Balance (LCY) Filter                      >0             All rows with Balance value greater than Zero

The output of the report should be as below:

JetSimpleReport-10

Stay tuned for more details in my future posts.
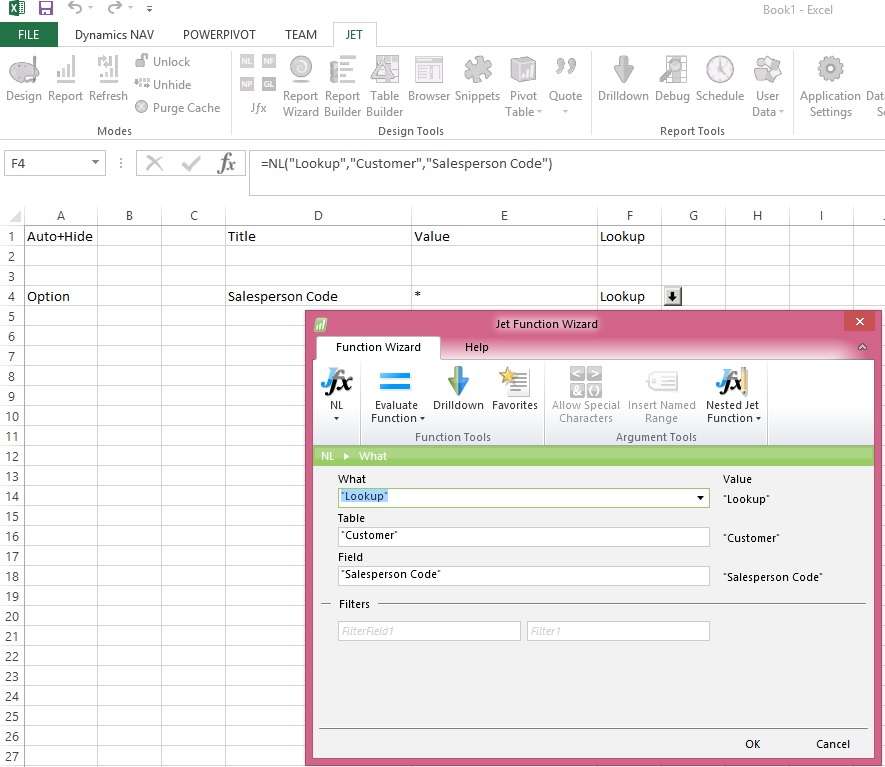
I will explain more about commands, filters, functions, lookup etc.…

Using NL( Lookup ) in Jet Reports Part-1

The NL(“Lookup”) function can be used to provide Lookup to the Users so that he can select from a specified list of values when setting their report filters. This will allow them to see the list of options available to them in regards to a particular report filter.

The most common (and basic) use of the NL(“Lookup”) function is to simply pull a list of values from the database.

For example, if a list of customer numbers (“No.”) from the “Customer” table is desired then the function would look something like this:
=NL(“Lookup”,”Customer”,”No.”)

The resulting lookup that the user sees would be:

Lookup-1

It is also possible to allow the user to see more than one value from a particular table. This can help the user to make a choice more easily by displaying additional details about the values returned.

Multiple fields can be displayed by placing them in an array. This is accomplished by placing the list of fields to be displayed, separated by commas, in the Field parameter and surrounding it with curly braces.

If the fields to be shown are the “Name” and the “Country/Region Code” associated with each customer “No.”, the resulting function would look something like this:
=NL(“Lookup”,”Customer”,{“No.”,”Name”,”Country/Region Code”})

The resulting lookup would be:

Lookup-2

NOTE: The first field in the array is the field that will be returned by the Lookup form.

In addition to selecting multiple fields to be displayed in the list, it is also possible to customize the headers, that appear at the top of the Lookup window. This can be done by placing “Headers=” in one of the FilterField parameters of the NL(“Lookup”) function.

For example, instead of the field names appearing as “No.”, “Name”, and “Country/Region Code”, it has been decided that they should be displayed as “Cust. No.”,”Cust. Name”, and “Cust. State” to the user.

To do this, “Headers=” will be added in one of the FilterField parameters, and the desired names will be placed in the associated Filter parameter. The function should look like this:
=NL("Lookup","Customer",{"No.","Name","Country/Region Code"},"Headers=",{"Cust. No.","Cust. Name","Cust. State"})

The resulting Lookup window would now appear as:

Lookup-3

In addition to returning a list of values from the database, it is also possible to manually specify the values that will be returned.

This allows you to present the user with a list of values that are not stored in your database. The syntax that will be used is slightly different. Since data is no longer being returned directly from the database, the Table parameter is no longer used to specify the table that the information will pull from. Instead, an array containing the values to be displayed is placed in the Table parameter of the Lookup function. The Field parameter will then contain the list of column headers of the Lookup window.

To create an NL(“Lookup”) function that will display “East”, “West”, “North”, and “South” for Directions, the function will be:
=NL("Lookup",{"East","West","North","South"},"Direction")

The resulting lookup window would now be:
Lookup-4
NOTE: It is important to place the field name that will be displayed at the top of the Lookup window (in this example “Direction”) in the Field parameter. Omitting this will not display any values in the Lookup Window.

In addition to placing the values in the NL(“Lookup”) function itself, a cell reference can also be used. The following example will display the exact same result as the previous example, but the values are specified by a cell reference instead of text.

It is also possible to display multiple columns in the Lookup Window by utilizing cell references. To achieve this, another column of values will need to be inserted next to the values that we are already displaying. Once this is done, the cell reference in the NL(“Lookup”) function will also need to be expanded to encompass both columns of data. Since multiple columns are now being specified, names for these columns will also need to be defined in the NL(“Lookup”) function as well. This is done by using the array syntax that was described above in order to specify the field names in the Field parameter, in this case “Direction” and “Description”.
=NL("Lookup",F5:G8,{"Direction","Description"})

Below is an example of what this would look like:

Lookup-5

Will come up with more details in my next post on this.

Stay tuned for more details in my upcoming post.

Creating Simple List Report in Excel Using Jet Reports Part-1

Dear friends I will discuss today simple report creating in Jet Reports.

I will take a simple example for creating Customer List showing the Credit Limit & Balances.

We will be using two basic Functions of Jet Reports NL & NF.

Then we will add few more features in my next post on this report.

Let’s Start Step wise Step:

Step 1: Add NL Function to retrieve Records from Customer Table.
JetSimpleReport-1
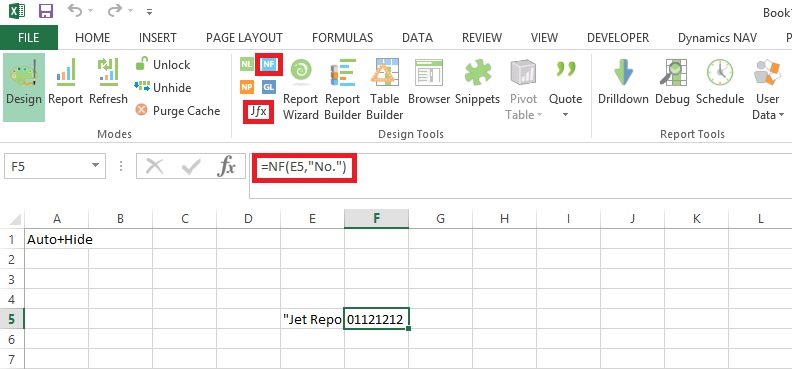
I have Add NL Function in Cell E5 as shown above, if want to add using Jfx – NL place a Cursor in E5 and press NL from Jfx Group of functions and fill as below:
JetSimpleReport-2

Step 2: Add Fields which you wish to include in your Report using NF Jfx Function.

I am adding No. field from Customer Table.

Here we have already created the connection to Customer Table in previous Step. This will retrieve all Fields and Records from the Customer Table.

Using NF function I am selecting the Fields of which we want to show/include value in our Report.

I have add the Function in Excel as shown below:
JetSimpleReport-3
I have Add NF Function in Cell F5 as shown above, if want to add using Jfx – NF place a Cursor in F5 and press NF from Jfx Group of functions and fill as below:
JetSimpleReport-4

Step 3: Following Step 2 add all other Fields.

The Excel should look as below:
JetSimpleReport-5

I have Added fields No., Name, Credit Limit (LCY), Balance (LCY).

I have also added Heading for these fields, and applied general Excel Formatting.

The Column E with NL function, I have Hide from the Report Output as the information is having no relevance showing to User.

Now we are god to see the output of our Report Created above. Output format of this report will be as below:
JetSimpleReport-6

Stay tuned to have more updates in my upcoming posts.