Showing posts with label BI. Show all posts

Saturday, 30 July 2016

Working with Alerts in Power BI

Knowing about changes to important metrics quickly some time can help you taking quick decisions or help you keep eyes on things you care most.

With data driven alerts in Power BI, you can now get notifications when a metric you care about on your dashboard exceeds a set threshold.

Alert notifications will be sent to you as an email, and appear in your notification center on the web and in mobile apps.

You can set alerts for your numeric tiles featuring cards and gauges only. You have control over how often you want to be notified about your data, and whether you want to receive an email when your data goes beyond the limits you set.

Only you can see the alerts you set, even if you share your dashboard.

Alerts only work on data that is refreshed. When data refreshes, Power BI looks to see if an alert is set for that data. If the data has reached an alert threshold, an alert is triggered.

Alerts only work with numeric data types.

Alerts only work on data that is refreshed. They do not work on static data.

Today we will see how to work with Alert feature in Power BI.

Login to your Power BI using your credentials.

Switch to your Dashboard.

I have one ready to use dashboard from my previous post to show Alert feature I am using the same.

As discussed above it works only for Numeric & Gauges Tiles only, for others you will not get even the Alert option.

Luckily I have one on my Dashboard, if want to learn how to create Numeric Tiles or more details on working with Power BI you can refer to any of my previous posts on Power BI. However you can find here one direct Link to the topic in question.

You see I have selected my Numeric Tile in below screen shot.
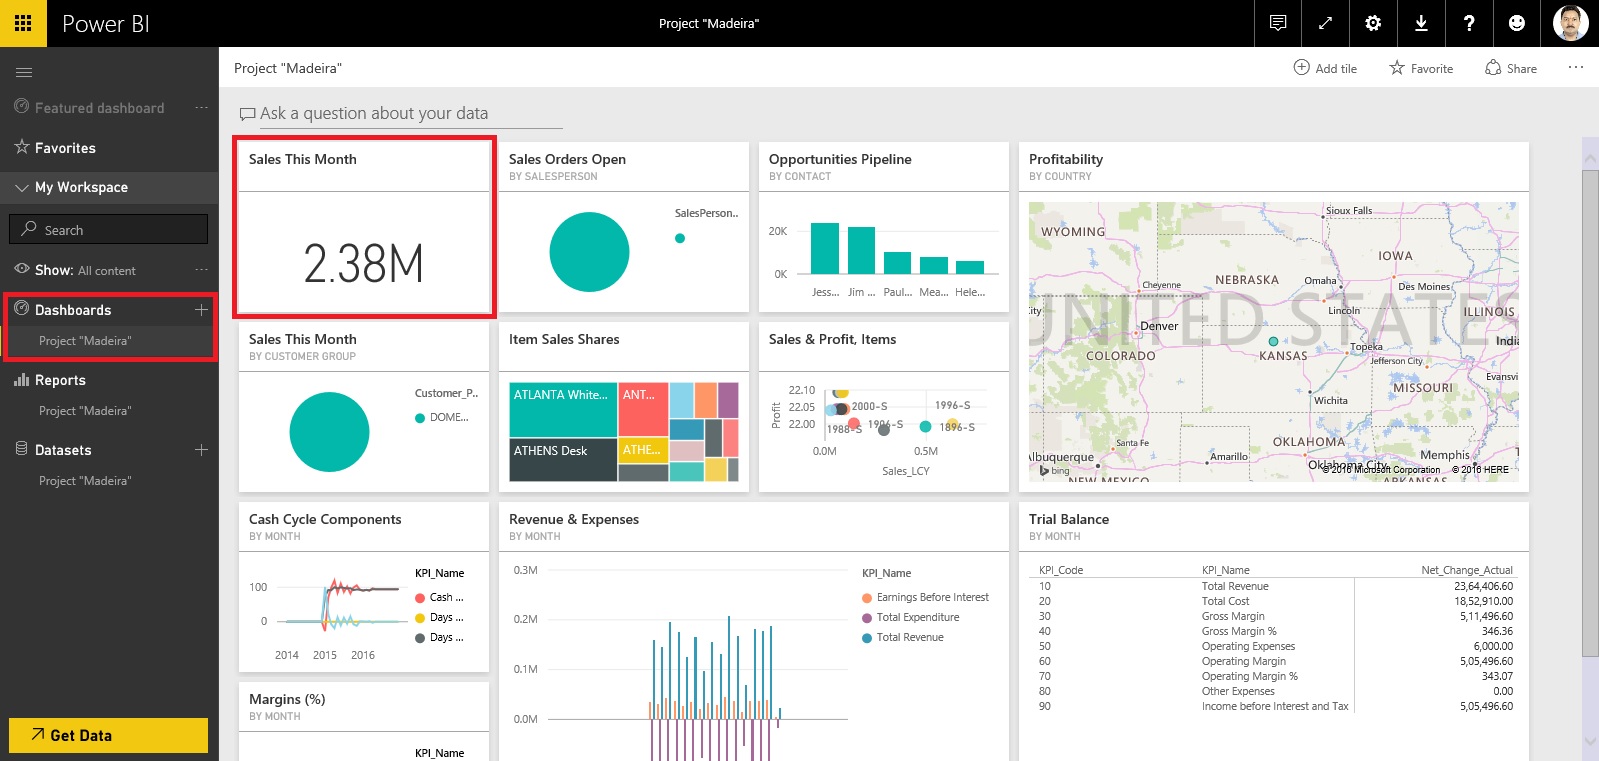
DataAlert-1

How to Set Data Alerts:

From a dashboard tile, select the ellipses.

Select the bell icon  to add one or more alerts.
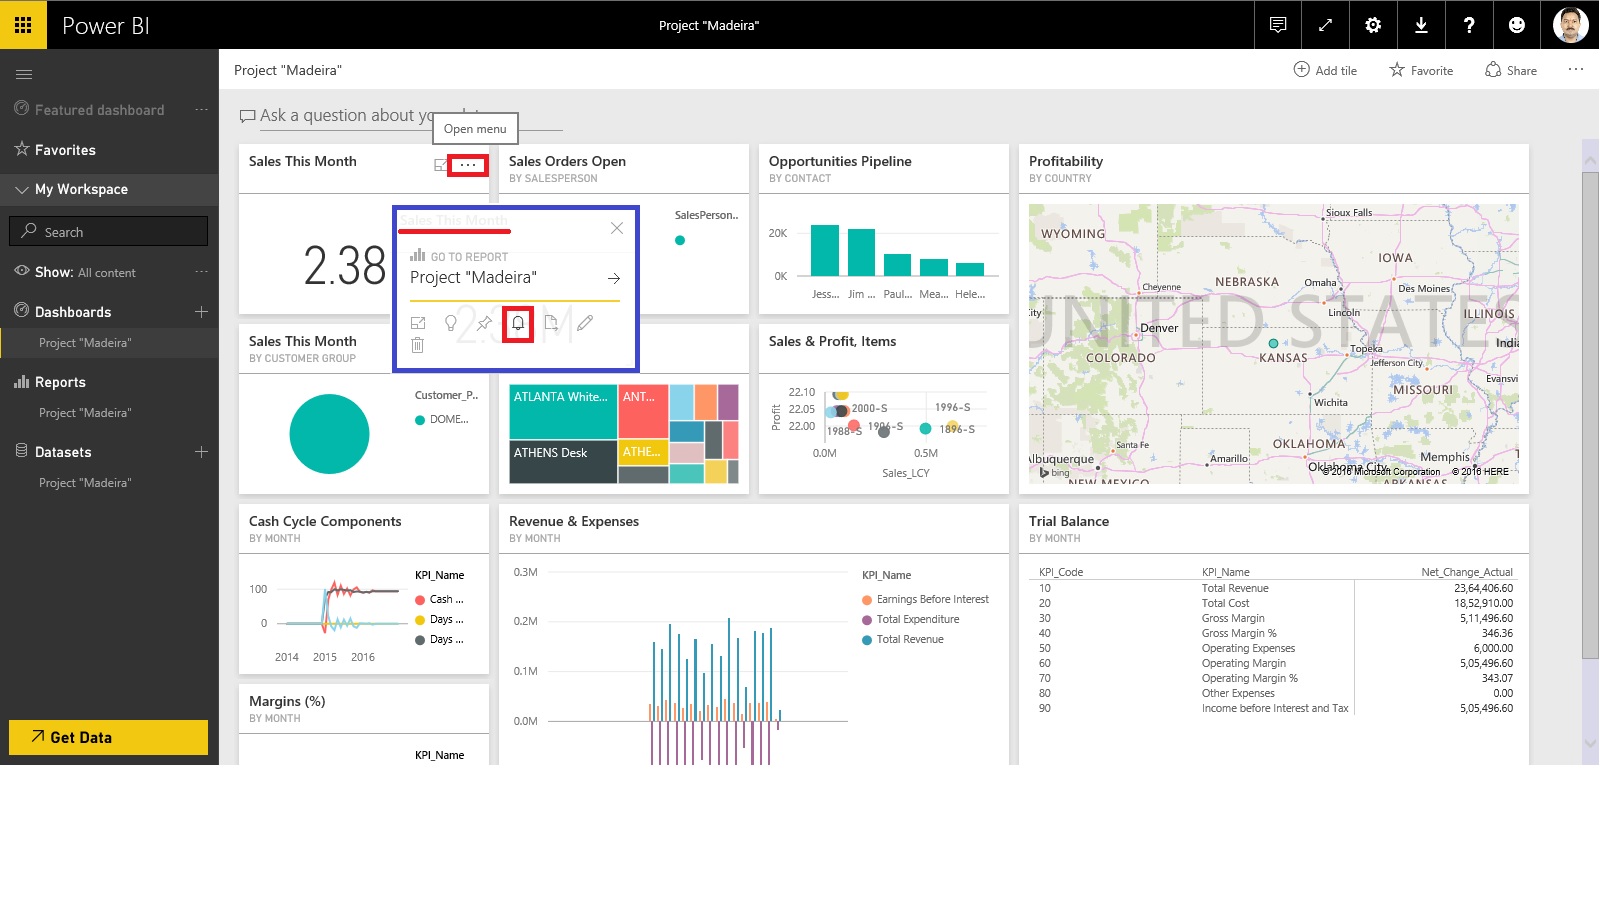
DataAlert-2

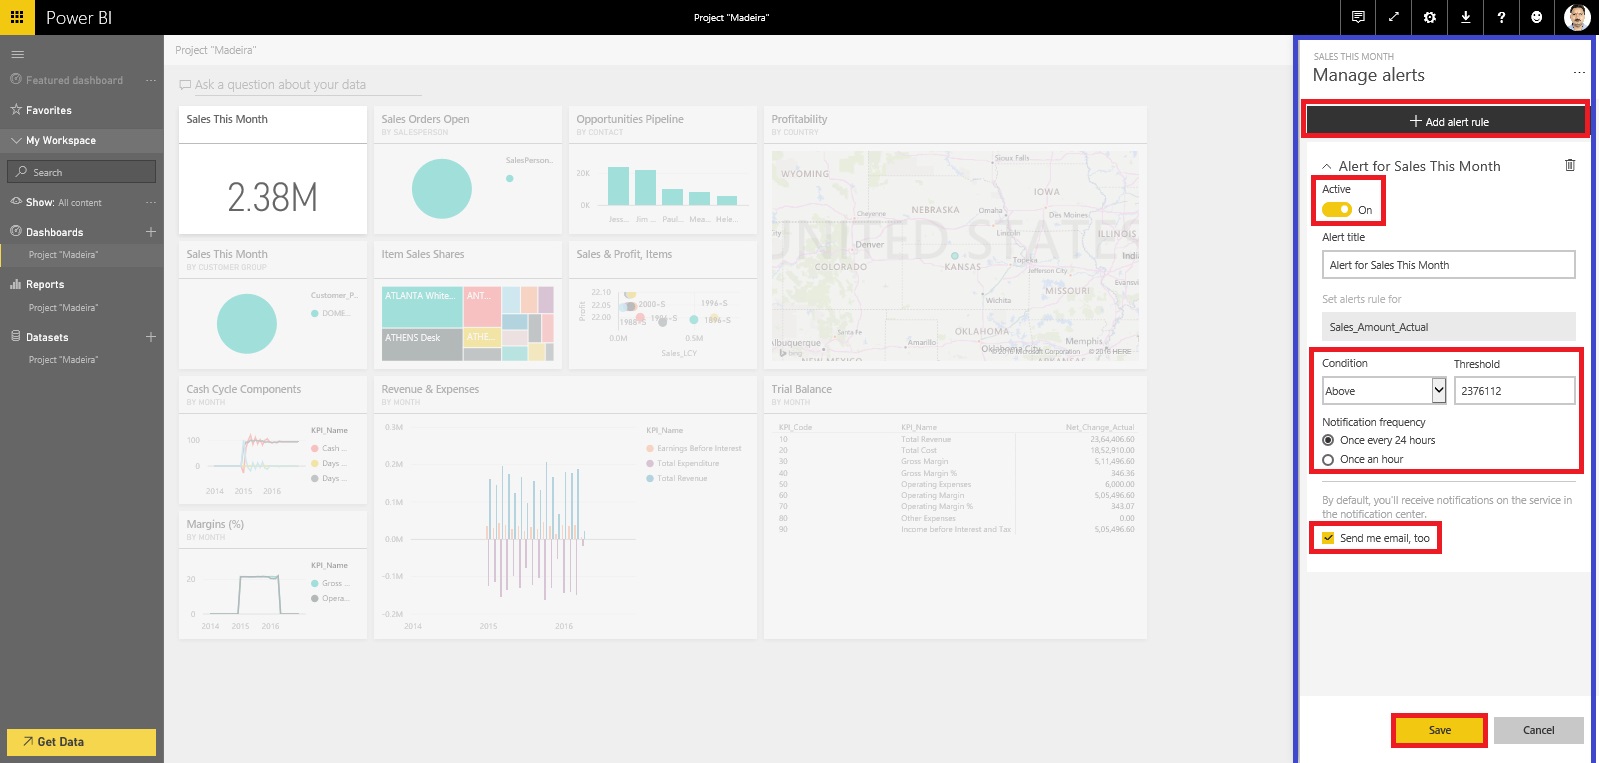
Click on Add Alert Rule.

To start, ensure the Active slider is set to ON, and give your alert a title.
DataAlert-3


Set your Condition, Threshold, and Notification Frequency also don’t forget to tick on send me mail too.

Click on Save to save your Alert.


Receiving alerts:

When the data being tracked reaches one of the thresholds you've set, several things will happen.

Power BI checks to see if time have lapsed or more than depending on the option you selected since the last alert was sent.

As long as the data is past the threshold, you'll get an alert every hour or every 24 hours depending on option you selected.

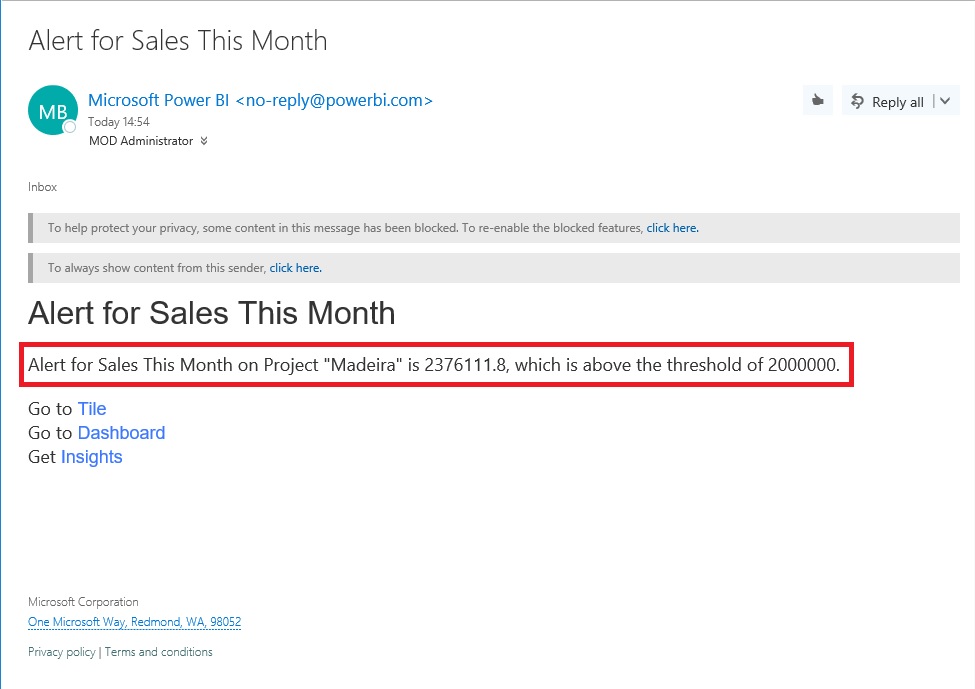
If you've set the alert to send you an email, you'll find something like as shown in below screen, this in your Inbox.
 

DataAlert-4


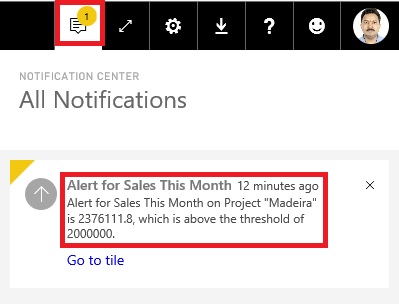
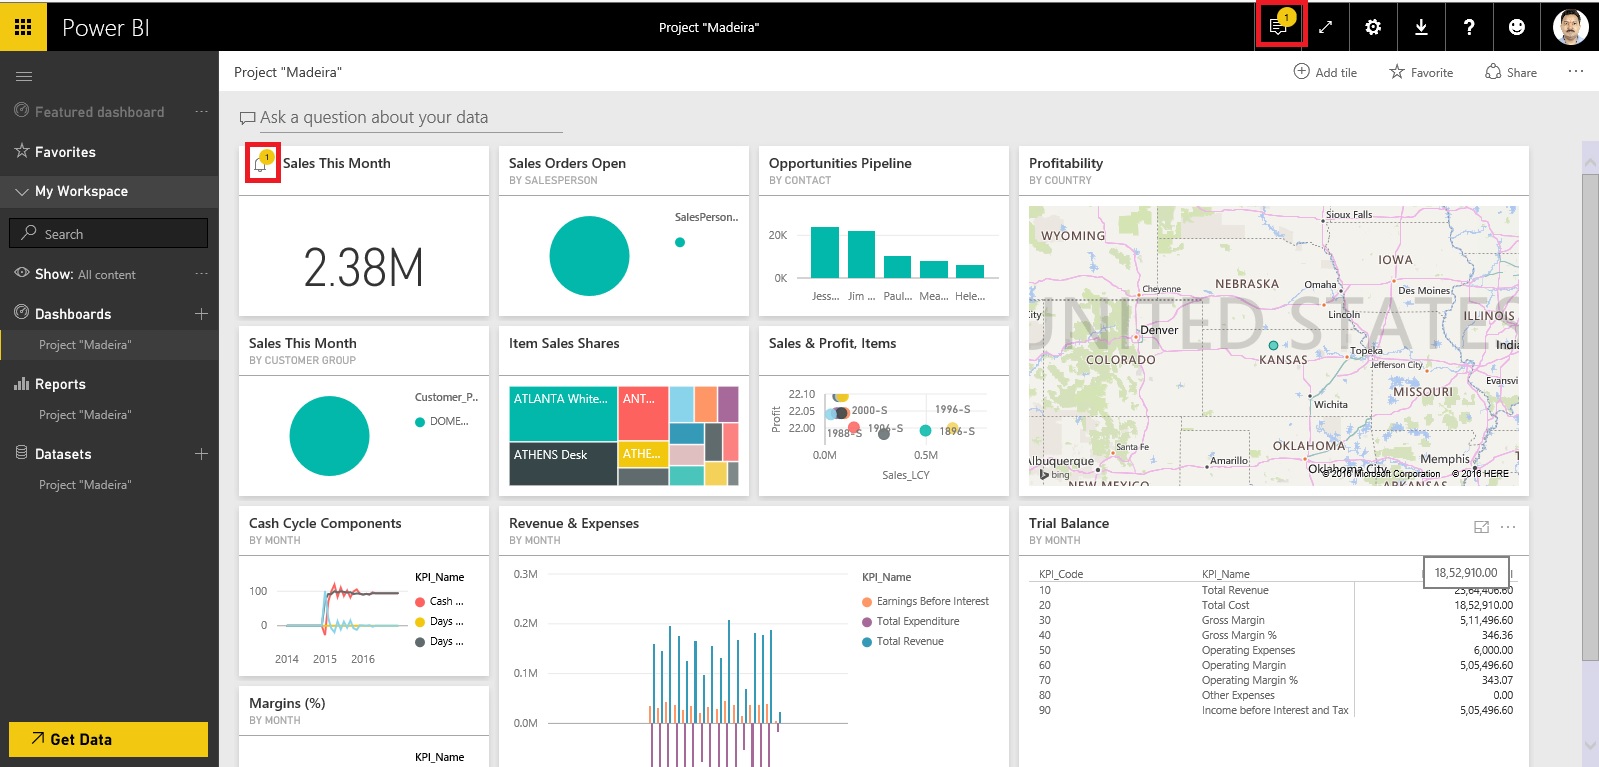
Power BI will add a message to your Notification center and adds a new alert icon to the applicable tile as shown in below screen.
DataAlert-5


Access to your Notification.

DataAlert-6


Manage alerts:

There are three ways to manage your alerts:

From the dashboard tile

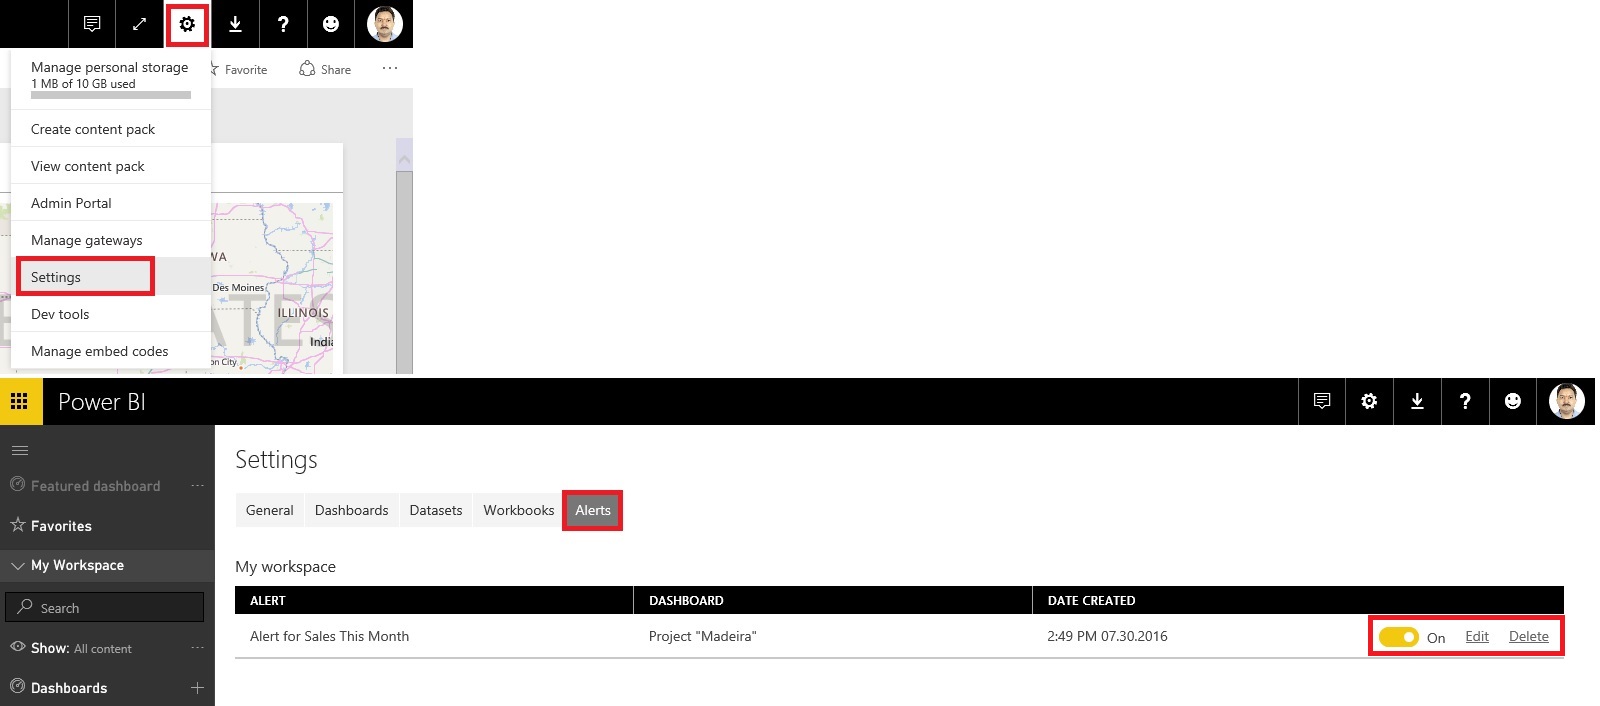
From the Power BI Settings menu

On an individual tile in the Mobile App
DataAlert-7


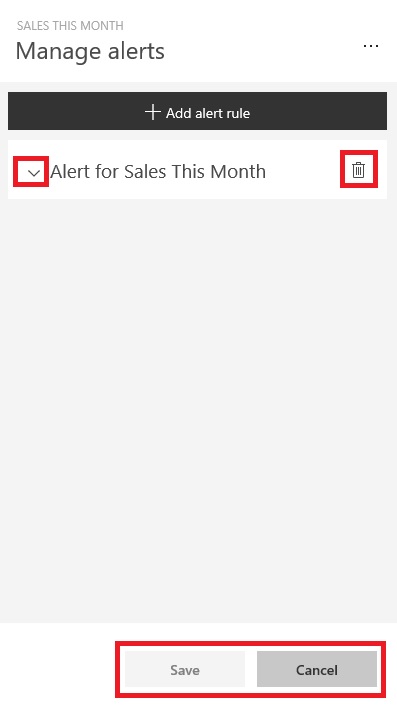
As we have seen above how to create Alerts follow same steps to access Alert Window.

At the Left click on Expand make Necessary Modifications and save.

At the right select the trashcan to delete the Alert.

Select cancel to return to previous window.
 

DataAlert-8

From here you can turn alerts on and off, open the Manage alerts window to make changes, or delete the alert.


That’s all for today.

I will come up with more details in my upcoming posts.

Till then keep exploring and learning.


Thursday, 30 June 2016

Gaining the Competitive Advantage with BI

See how a robust business intelligence solution can help you leverage technology in order to gain new visibility on your business that will enable profitable, data-driven decisions on a daily basis.

Video-1

http://jetreports.wistia.com/medias/bkl74oqz8r?embedType=async&videoWidth=640

Video-2

http://jetreports.wistia.com/medias/yoa1upnb80?embedType=async&videoWidth=640

Wednesday, 20 April 2016

Now Power BI Added to Microsoft Trust Center

The Microsoft Trust Center provides a single point of reference for cloud trust resources, including documentation of our adherence to international and regional compliance certifications and attestations, privacy and data protection policies and processes, data transfer and location policies, and security features and functionality.

When you entrust your data to the Microsoft Cloud, you will have questions. Where is it? Who can access it? What is Microsoft doing to protect it? How can you verify that Microsoft is doing what it says?

For more information see this Link: https://www.microsoft.com/en-us/trustcenter

https://powerbi.microsoft.com/en-us/blog/power-bi-added-to-microsoft-trust-center/

The Power BI service is built on Azure, Microsoft’s cloud computing platform, and leverages Azure’s robust set of security technologies and practices. These help ensure that Power BI is resistant to attack, safeguards user access, and helps secure your data through encrypted communications.

As a Power BI customer, you know, through clearly stated policies and procedures, where your customer data is stored and how we help secure it, as well as who can access it and under what circumstances.

Monday, 18 April 2016

How to add Video Tile on Power BI Dashboard

Previously, a Video Tile released by BI supports YouTube videos. Video tiles allow you to customize your dashboard and add a bit of personal look.

Now the video tile supports Vimeo videos too.

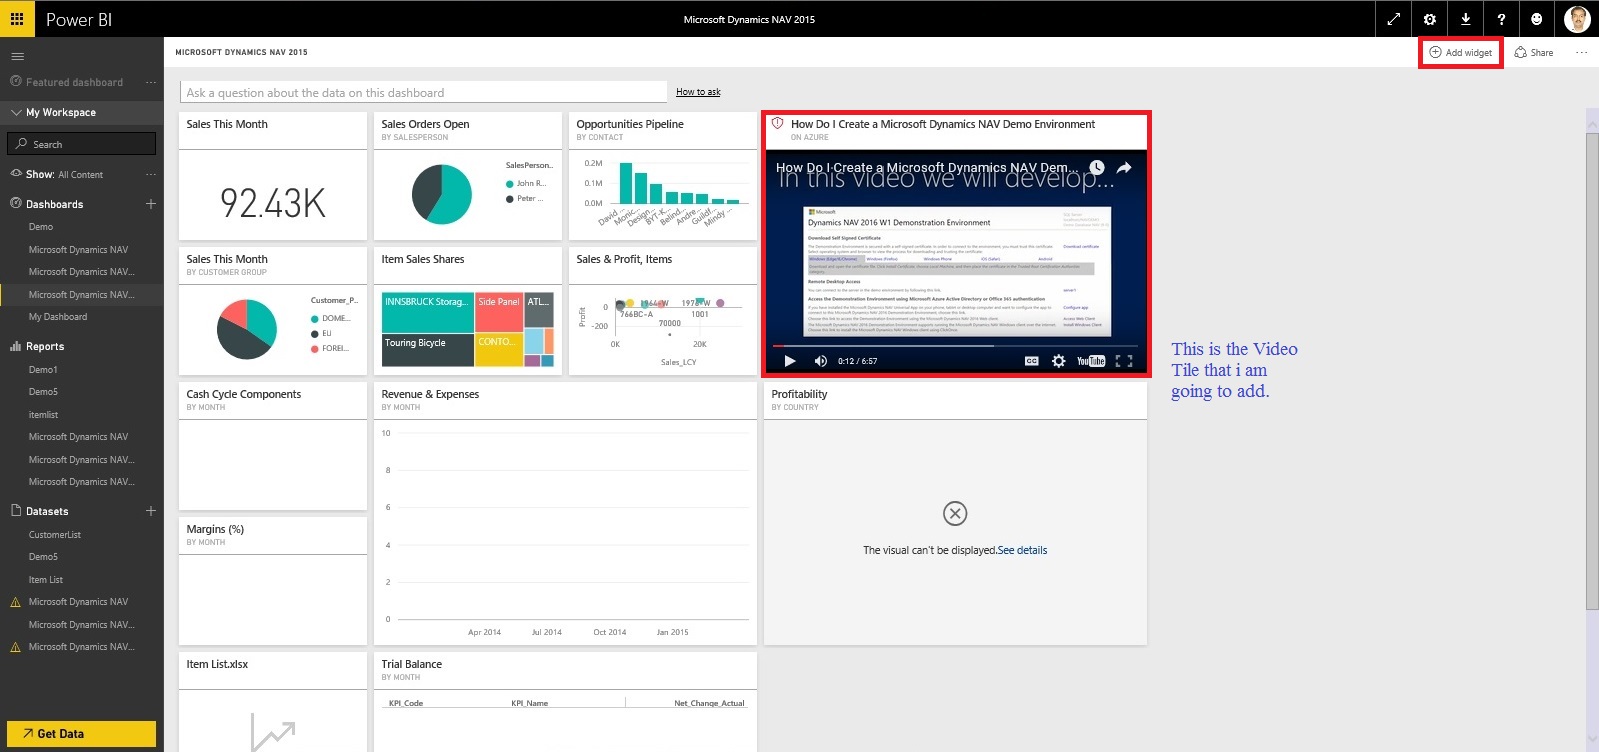
Add a video tile by selecting Add widget from the top right of the dashboard.

PBI Video - 1

Select Video from Add Tile window.

PBI Video - 2

Press Next Button.

PBI Video - 3

Provide your Title and Subtitle for the Video Tile.

Provide your YouTube or Vimeo video URL.

If required provide custom Link and other properties.

Select Apply to complete your action.

Vimeo URLs come in several different formats this supports most, but not all of these formats. In case your URL doesn’t works try for next format.

I have posted several posts related to Power BI, you can find them using below Links.

Microsoft Power BI – Part – I

Introduction to Power BI and Creating Report from Excel Data, Local Files.

Microsoft Power BI – Part – II

Introduction to few Features of Power BI

Microsoft Power BI – Part – III

Power BI Desktop, Creating Dataset & Reports from In Premise Database installation

Microsoft Power BI – Part – IV

Power BI Gateway usage

Microsoft Power BI – Part – V

Scheduling Refresh of Dataset & Report created using In Premise Database

Microsoft Power BI – Part – VI

Power BI Content Pack

Microsoft Power BI – Part – VII

Power BI Mobile App

Microsoft Power BI – Part – VIII

Power BI Content Pack

Microsoft Power BI – Part – IX

Power BI Publisher for Excel

Microsoft Power BI – Part – X

Analyse in Excel (preview)


Monday, 4 April 2016

Power BI - Overview and Learning

Microsoft Power BI is a collection of online services and features that enables you to find and visualize data, share discoveries, and collaborate in intuitive new ways. There are two experiences now available for Power BI: the new experience, generally referred to as Power BI, and the previous experience which is referred to as Power BI for Office 365.


Please check this link:- Overview and Learning

PowerBI-2


Wednesday, 30 March 2016

Microsoft Power BI – Part IX

Continuing from my previous post. Today we will see usage of Power BI Publisher for Excel.

In case you have missed my previous posts here I present the link to all previous posts below.

Microsoft Power BI – Part – I

Introduction to Power BI and Creating Report from Excel Data, Local Files.

Microsoft Power BI – Part – II

Introduction to few Features of Power BI

Microsoft Power BI – Part – III

Power BI Desktop, Creating Dataset & Reports from In Premise Database installation

Microsoft Power BI – Part – IV

Power BI Gateway usage

Microsoft Power BI – Part – V

Scheduling Refresh of Dataset & Report created using In Premise Database

Microsoft Power BI – Part – VI

Power BI Content Pack

Microsoft Power BI – Part – VII

Power BI Mobile App

Microsoft Power BI – Part – VIII

Power BI Content Pack

Sharing key Excel insights just got easier. Save snapshots of important PivotTables, Charts, cell ranges, and more from across all of your spreadsheets to a single location quickly with the Power BI publisher for Excel. Simply highlight the elements you want to save, then click the "Pin to" button: now you’ve got a powerful web dashboard that you can share with everyone in your organization.

Let us see how we can use this feature.

Login to Power BI with your credentials.

PowerBI-95

From Download Menu Section choose Power BI Publisher for Excel.

Or visit Link: https://powerbi.microsoft.com/en-us/excel-dashboard-publisher/

PowerBI-96

Select your desired Excel Version 32 or 64 bit as installed on your PC and download the Package.

Close your Excel and Install the Package and follow on screen guide.

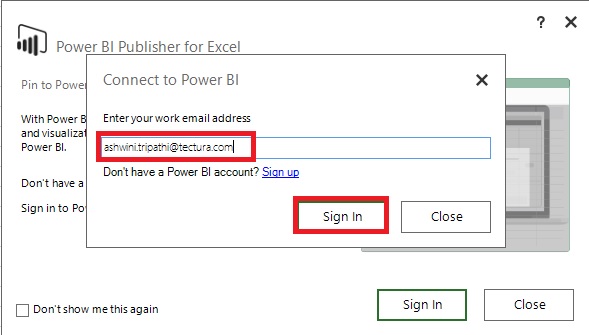
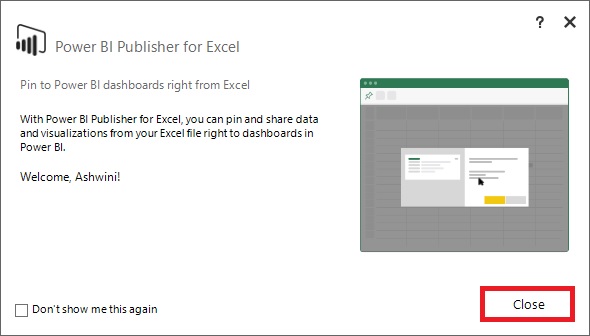
After Installation when you open your Excel First time after Installing the Package. You will get similar to below screen.

PowerBI-97

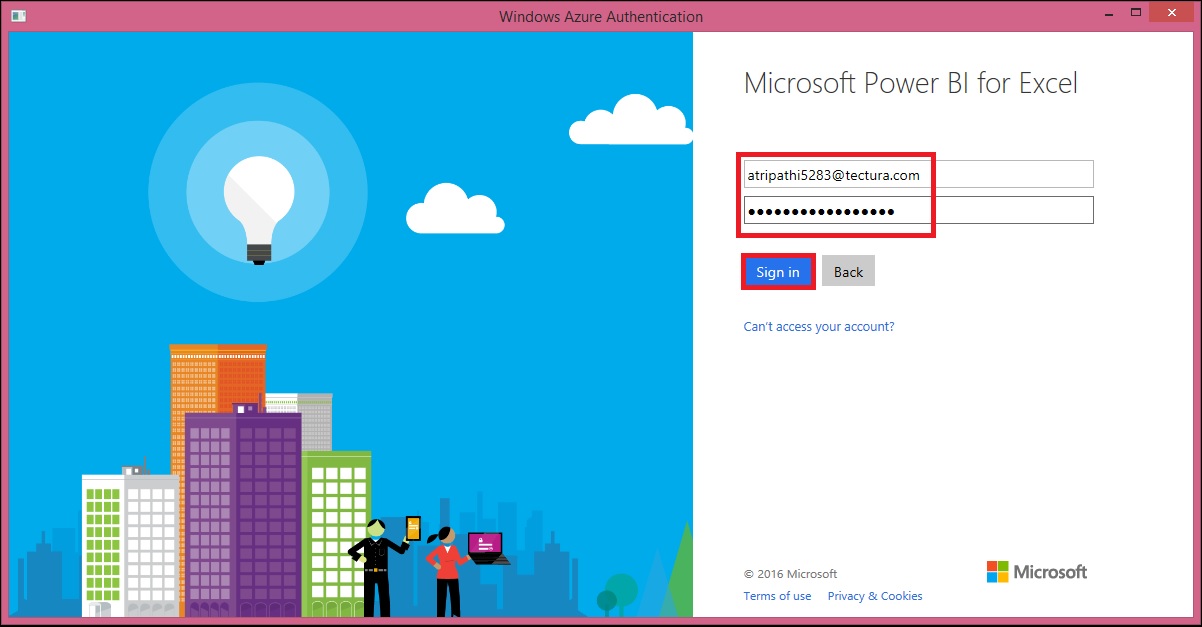
Sign in with your Power BI Credentials.

PowerBI-98


PowerBI-99


PowerBI-100

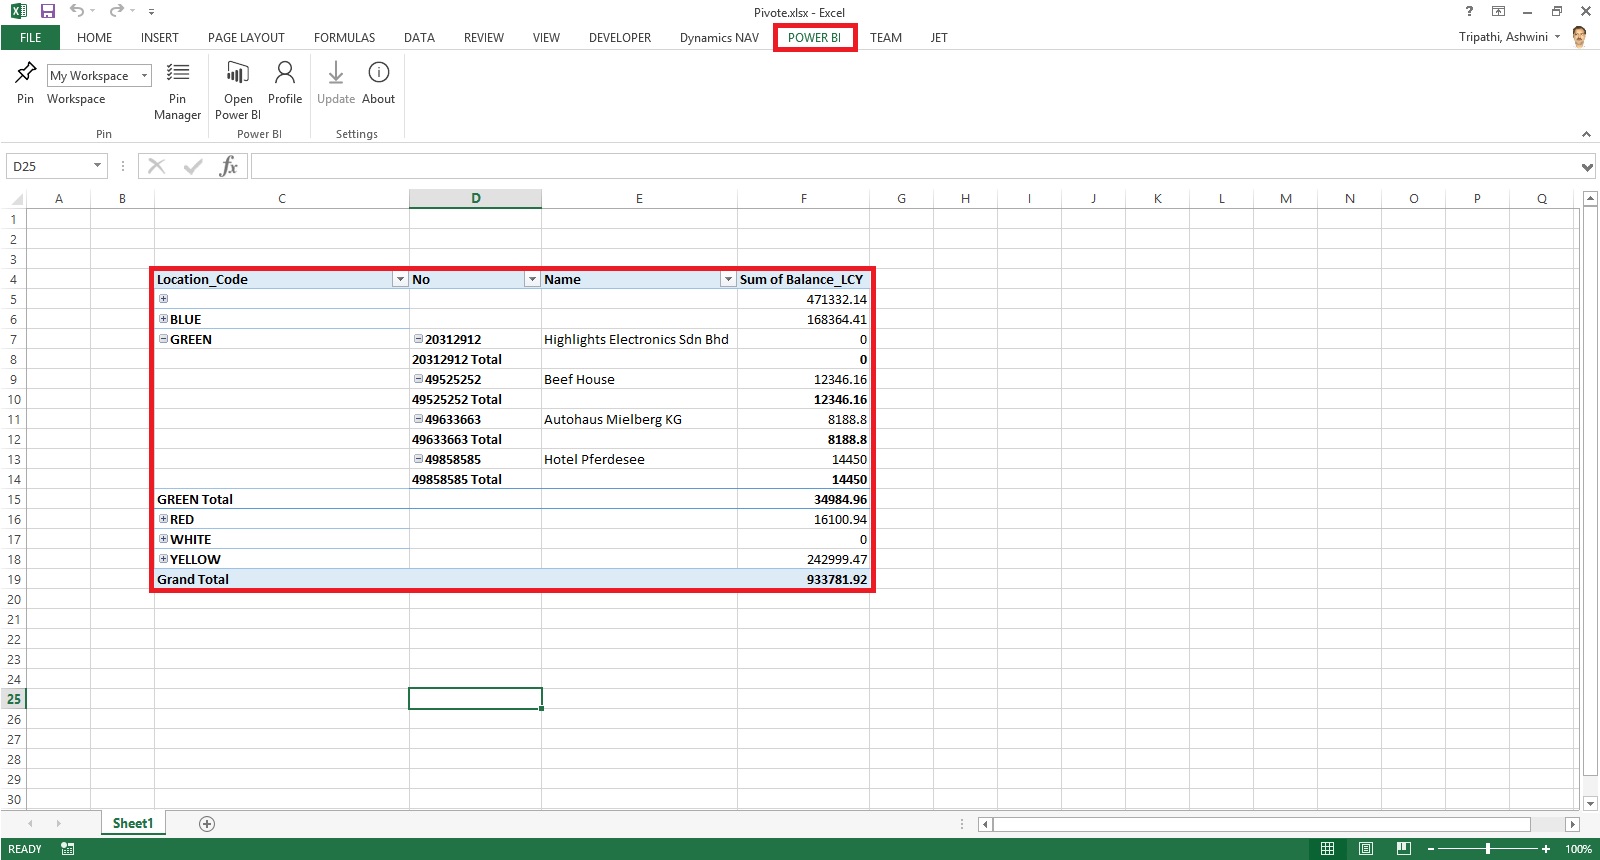
I have created a Pivot in excel as below which I want to share on my Desktop.

PowerBI-101

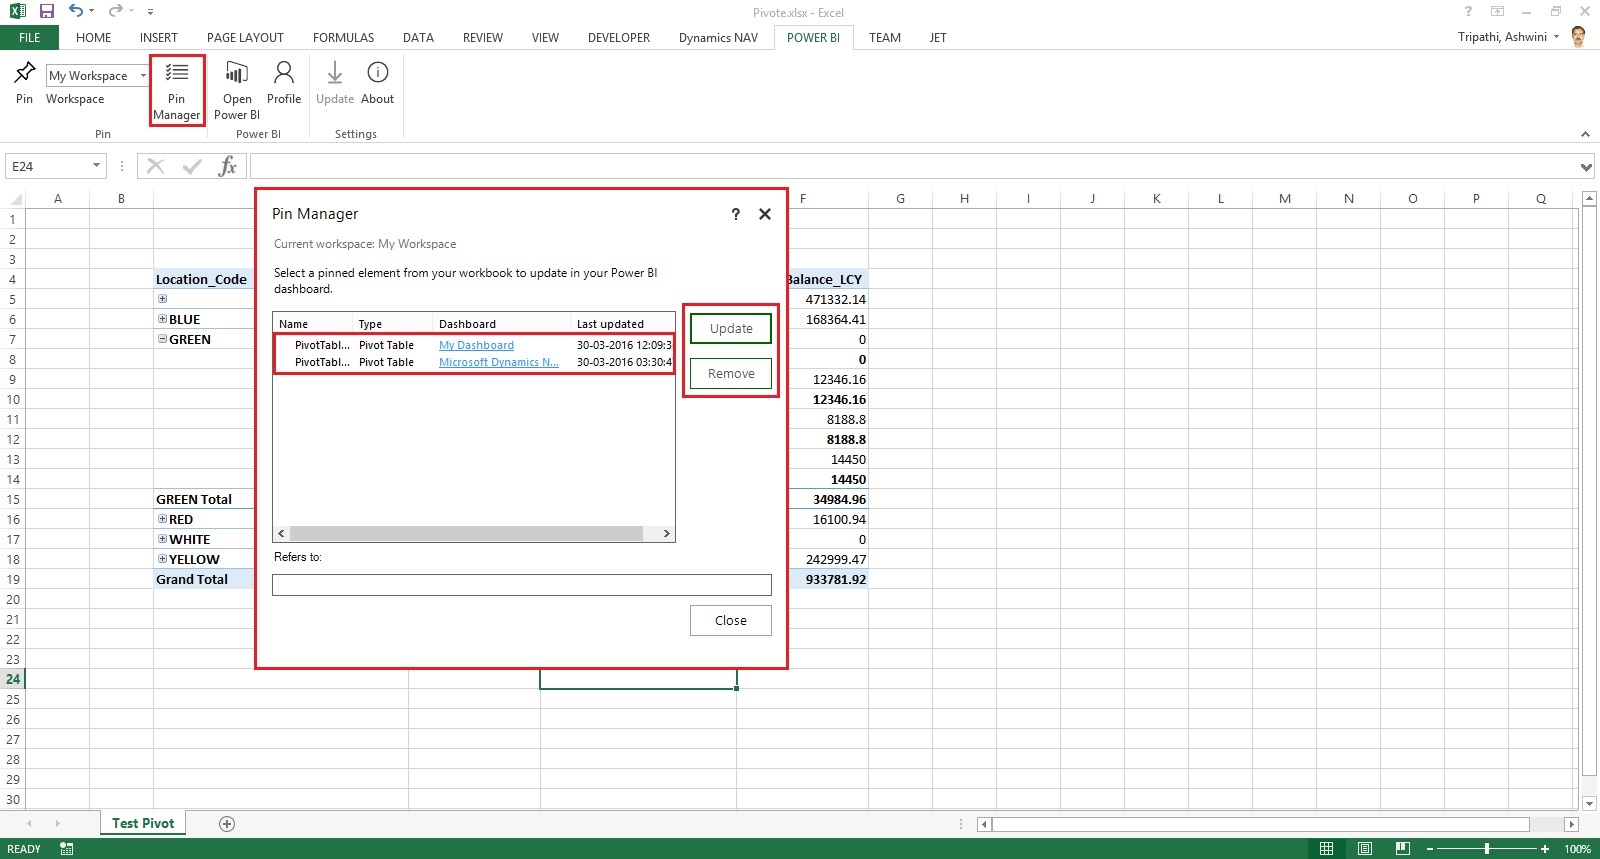
Select the Region/Range that you wish to publish from Power BI choose Pin, as shown below.

PowerBI-102

In my case I have already pined so confirmation Dialog Box is taken else it will Pin the Selected Range as a snapshot on selected Workspace.

PowerBI-103

Make sure you select right Workspace before you Pin.

PowerBI-104

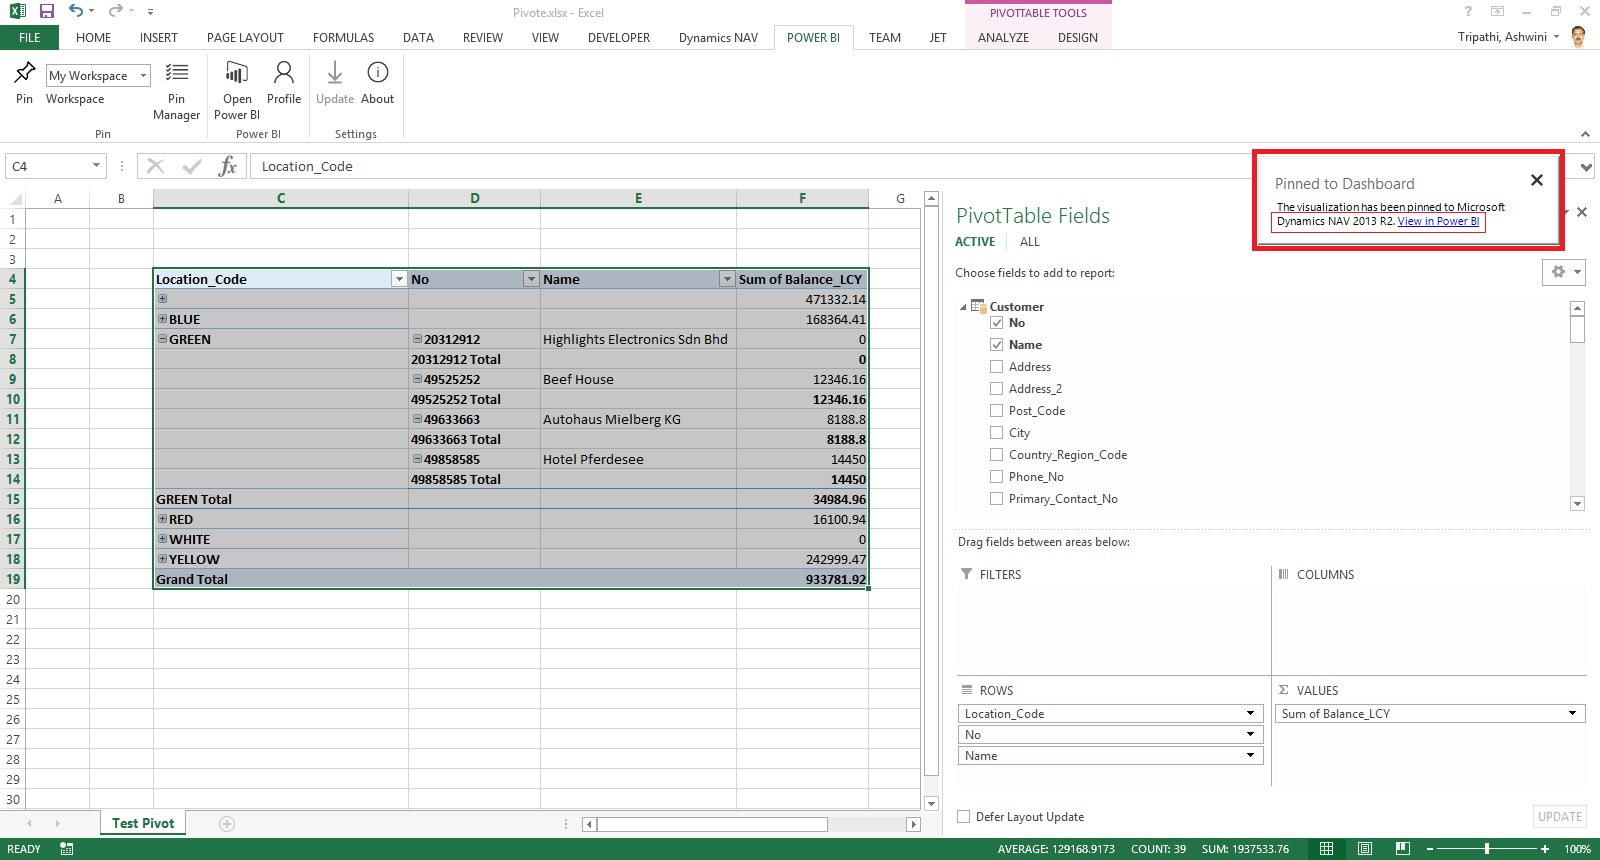
After Publishing you will get confirmation as below.

PowerBI-105

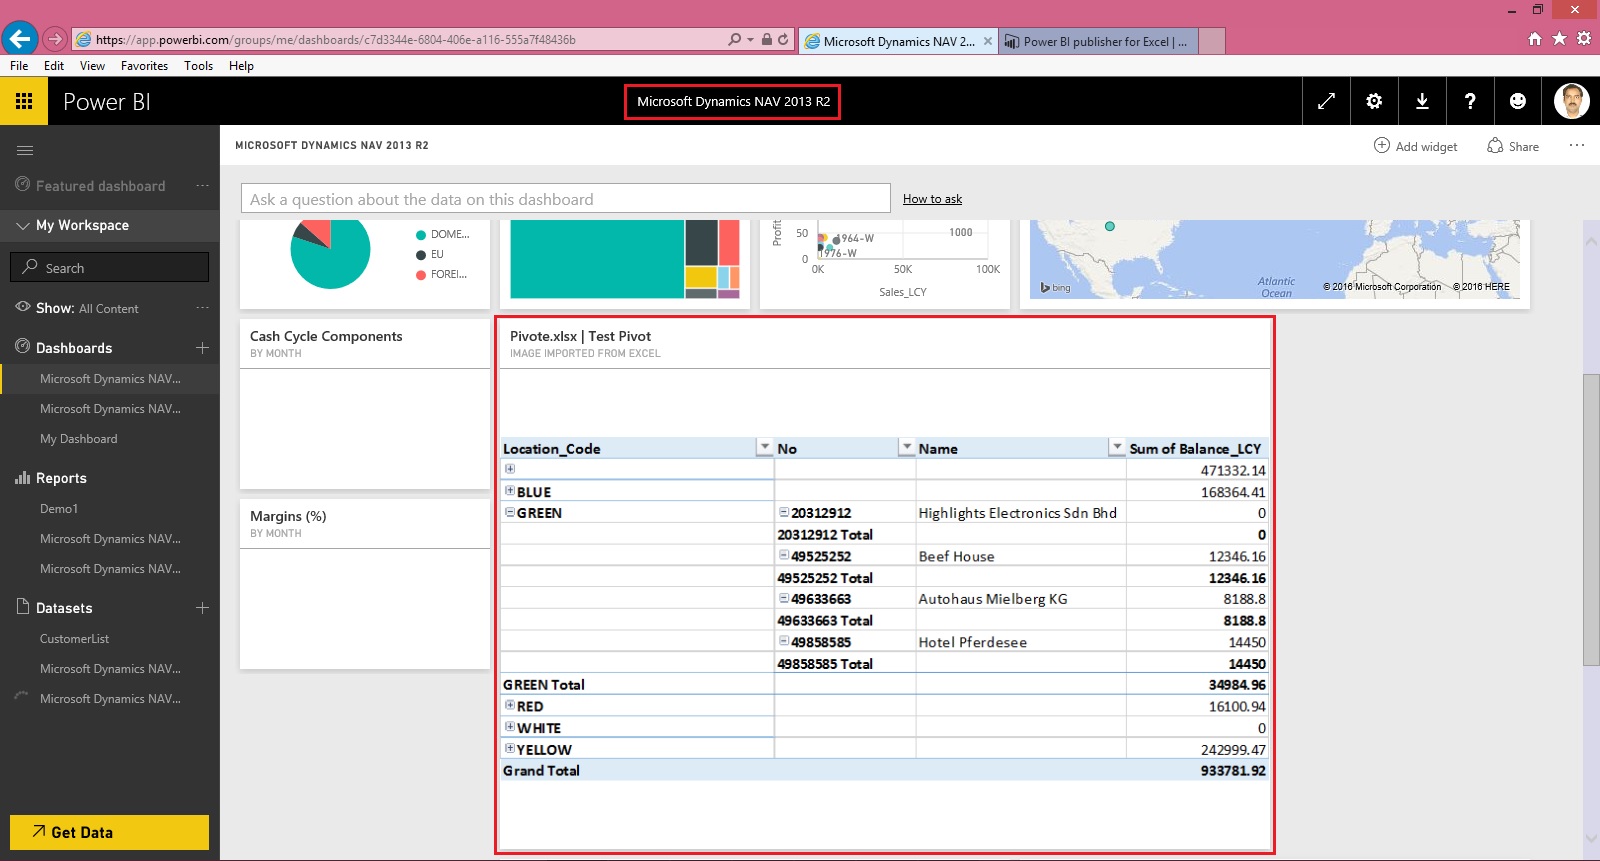
Using the Link, Login with your credentials to the Power BI and switch to the Dashboard on which you published.

PowerBI-106

This way you can Pin Snapshot of PivotTables, Charts, cell ranges, and more. You can update existing with new one and manage all your Pins.

PowerBI-107

Save your Excel and Exit.

PowerBI-108

Try useful feature.

I will come up with more details in my future posts.

Till then keep practicing and learning using online Blogs, help and documents.

Leveraging Business Intelligence for Ad Hoc Analysis

Leveraging Business Intelligence for Ad Hoc Analysis

Video-1

http://jetreports.wistia.com/medias/gmcjlekmpv?embedType=iframe&seo=false&videoWidth=640


Video-2

http://jetreports.wistia.com/medias/rkzi1ronom?embedType=iframe&seo=false&videoWidth=640


Tuesday, 29 March 2016

Microsoft Power BI – Part VIII

Continuing from my previous post. Today we will see usage of Power Content Pack to Refresh in Premise Navision Installation using Personnel Gateway.

Please see my previous post it will help you in continuing with this Walkthrough.

In case you have missed here I present the link to all previous posts here below.

Microsoft Power BI – Part – I

Introduction to Power BI and Creating Report from Excel Data, Local Files.

Microsoft Power BI – Part – II

Introduction to few Features of Power BI

Microsoft Power BI – Part – III

Power BI Desktop, Creating Dataset & Reports from In Premise Database installation

Microsoft Power BI – Part – IV

Power BI Gateway usage

Microsoft Power BI – Part – V

Scheduling Refresh of Dataset & Report created using In Premise Database

Microsoft Power BI – Part – VI

Power BI Content Pack

Microsoft Power BI – Part – VII

Power BI Mobile App

Step -1

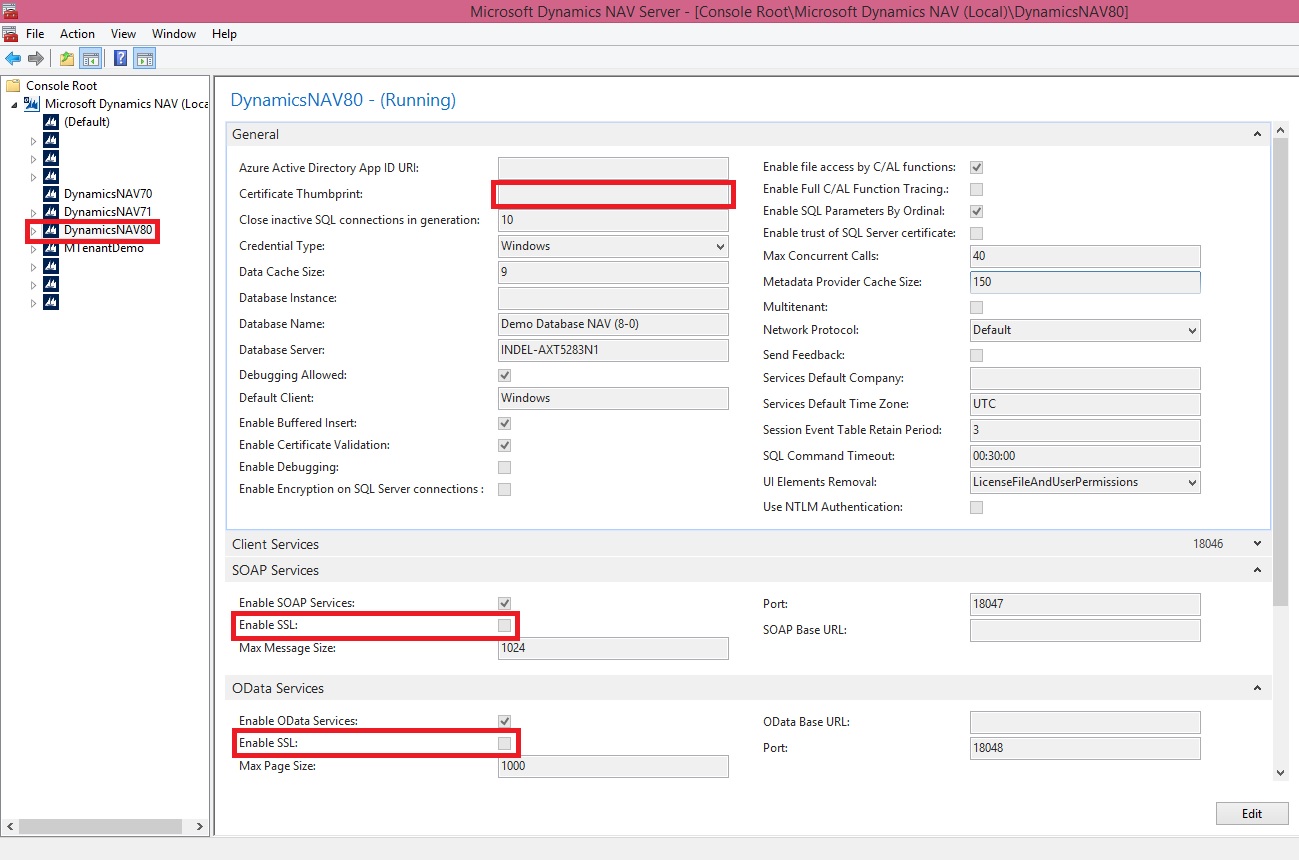
Check your Service is up & running, here we are not going to use SLL in fact Personnel Gateway.

PowerBI-86

Step -2

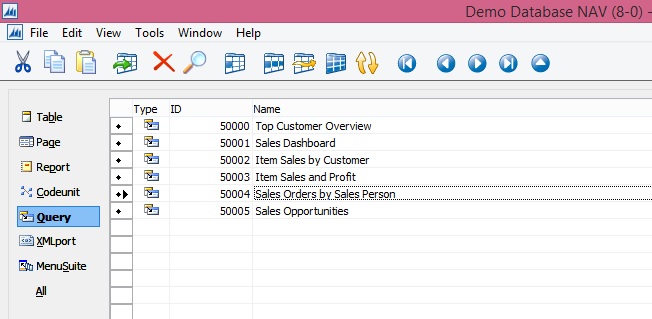
Make sure you Imported your Query Objects required for Power BI Dynamics Nav Content Pack. If you are not using NAV-2016, in my case I am using NAV-2015 for this Walkthrough.

PowerBI-87

Step -3

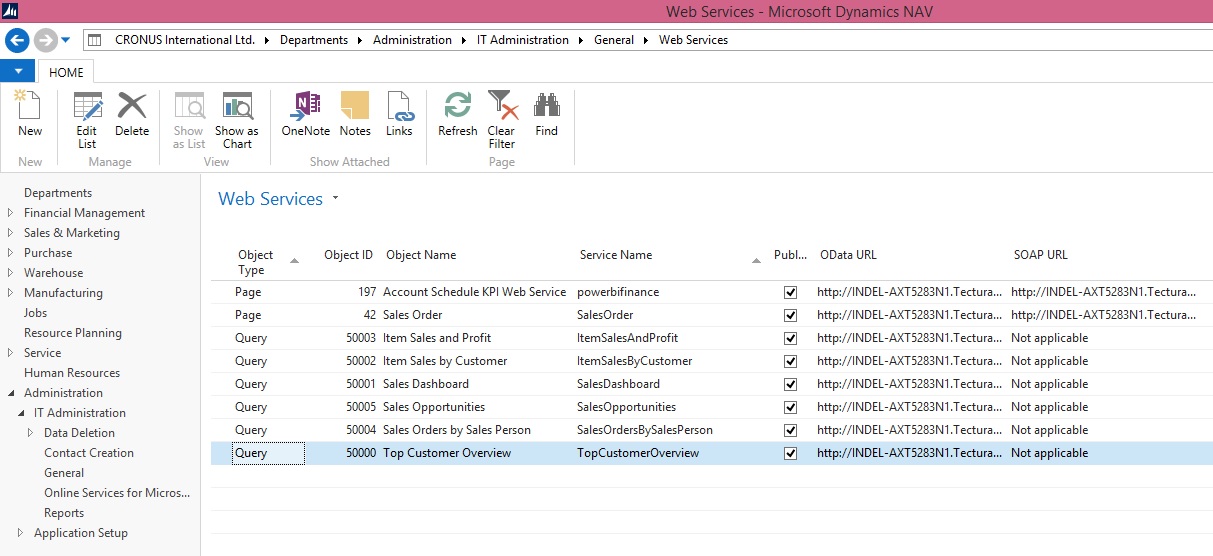
Make sure your Web Services are published.

PowerBI-88

Step -4

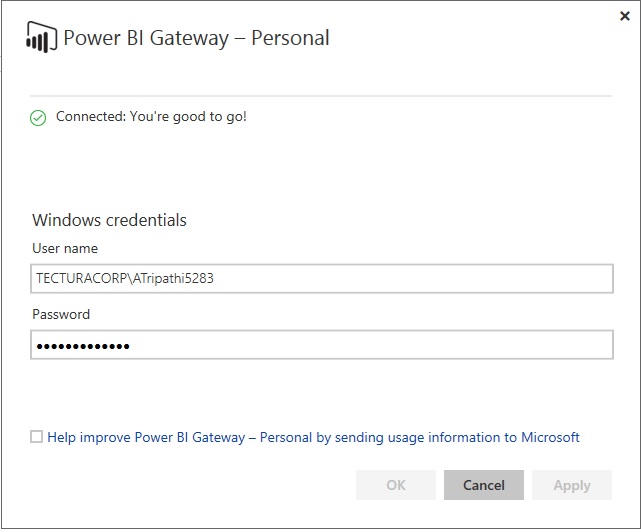
You have installed the Power BI Gateway – Personal and Login to it using your Credentials.

PowerBI-89

Step – 5

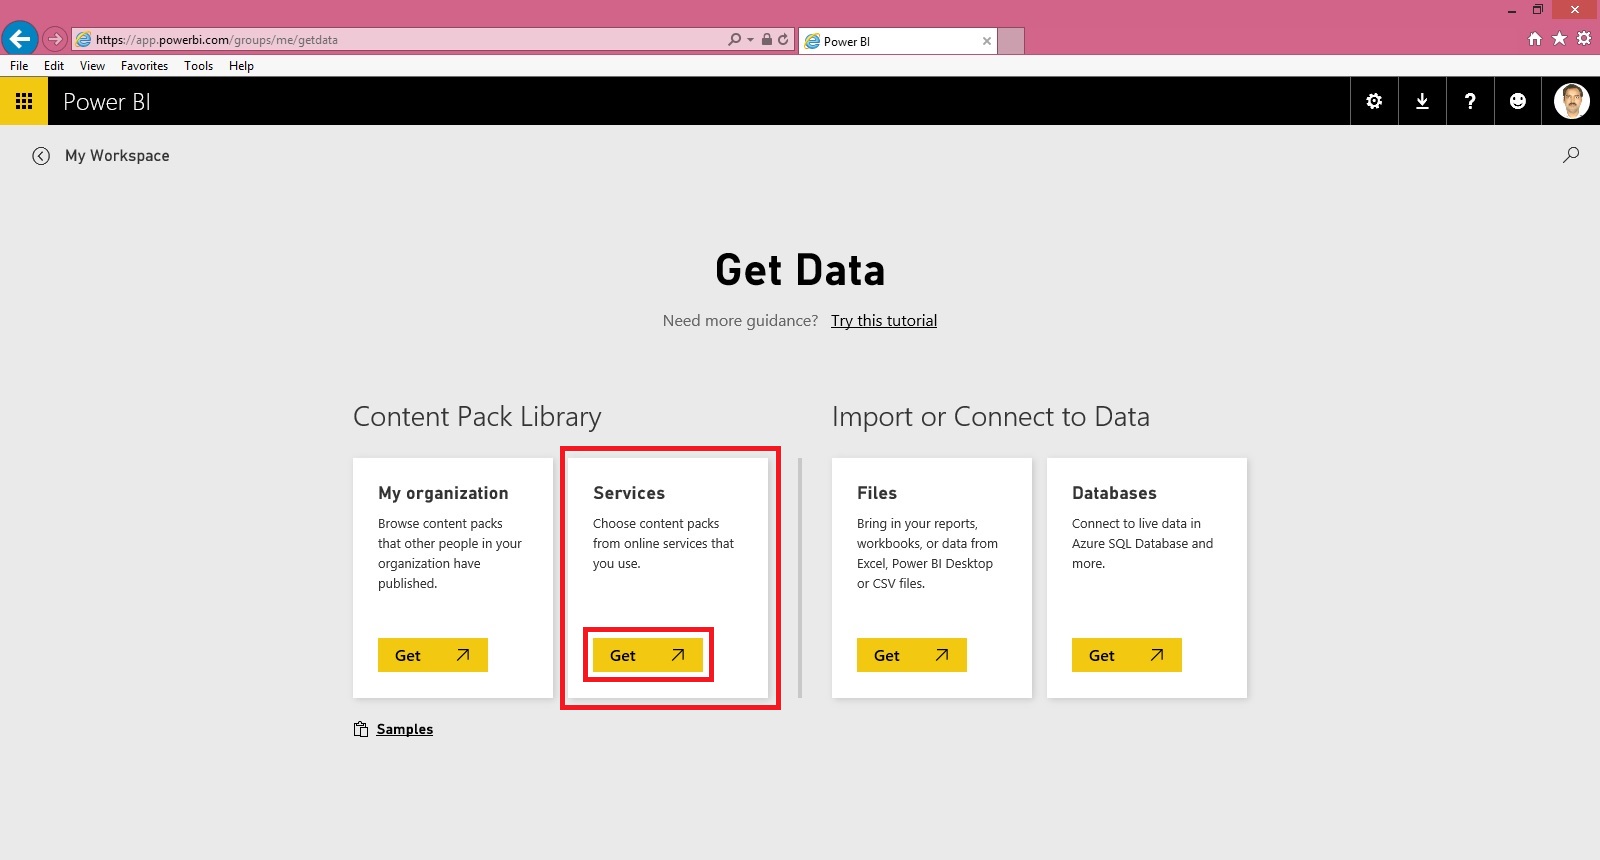
Login to PowerBI using your Credentials and choose Get Data from Bottom Left Corner in your Navigation Bar.

PowerBI-90

Step – 6

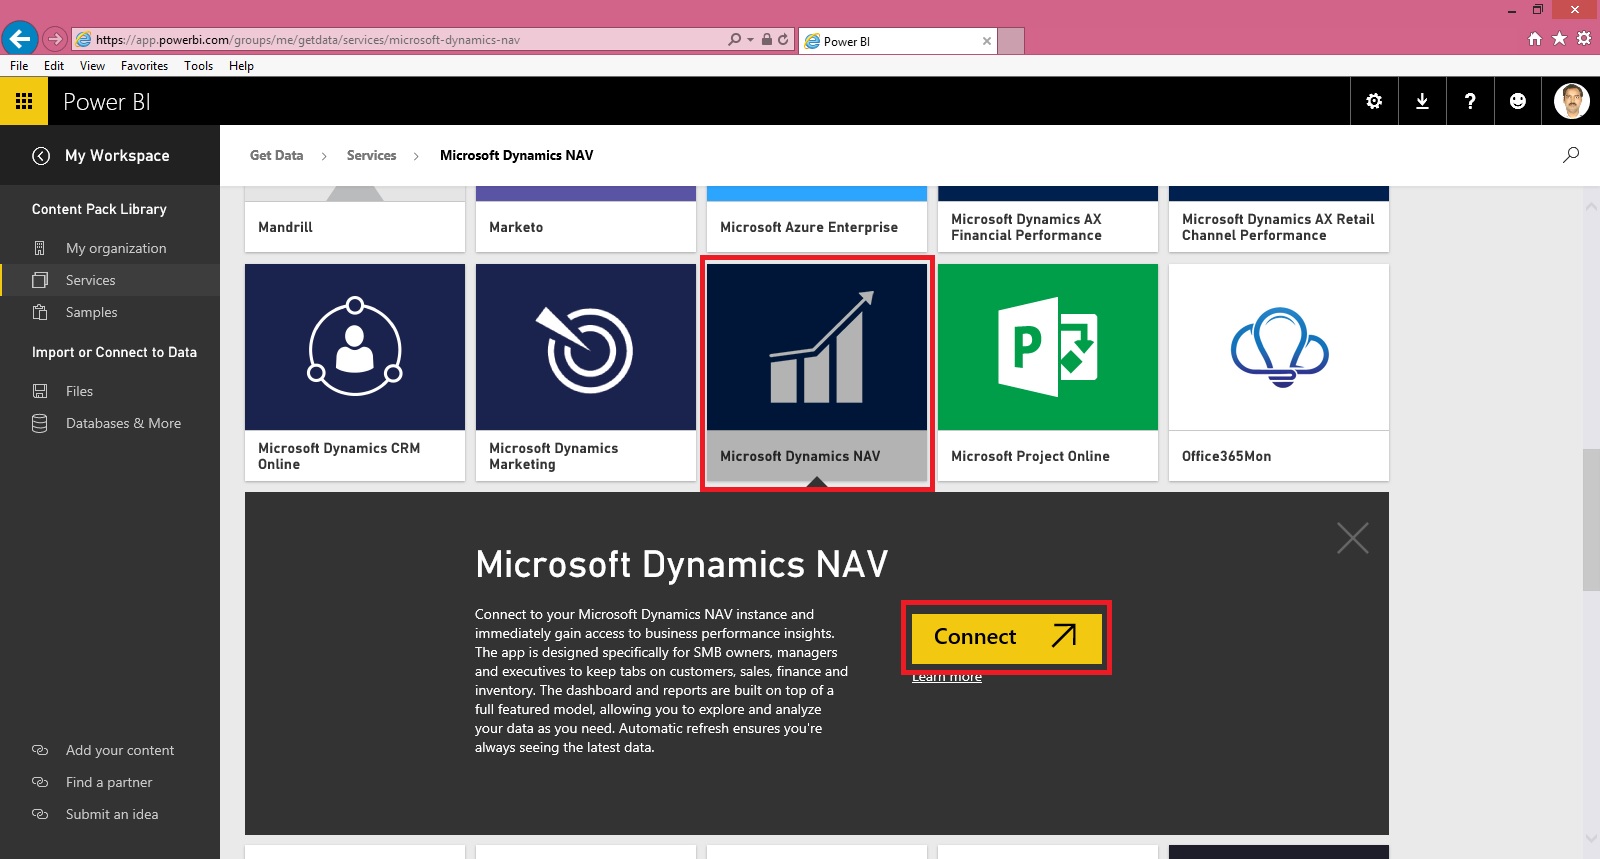
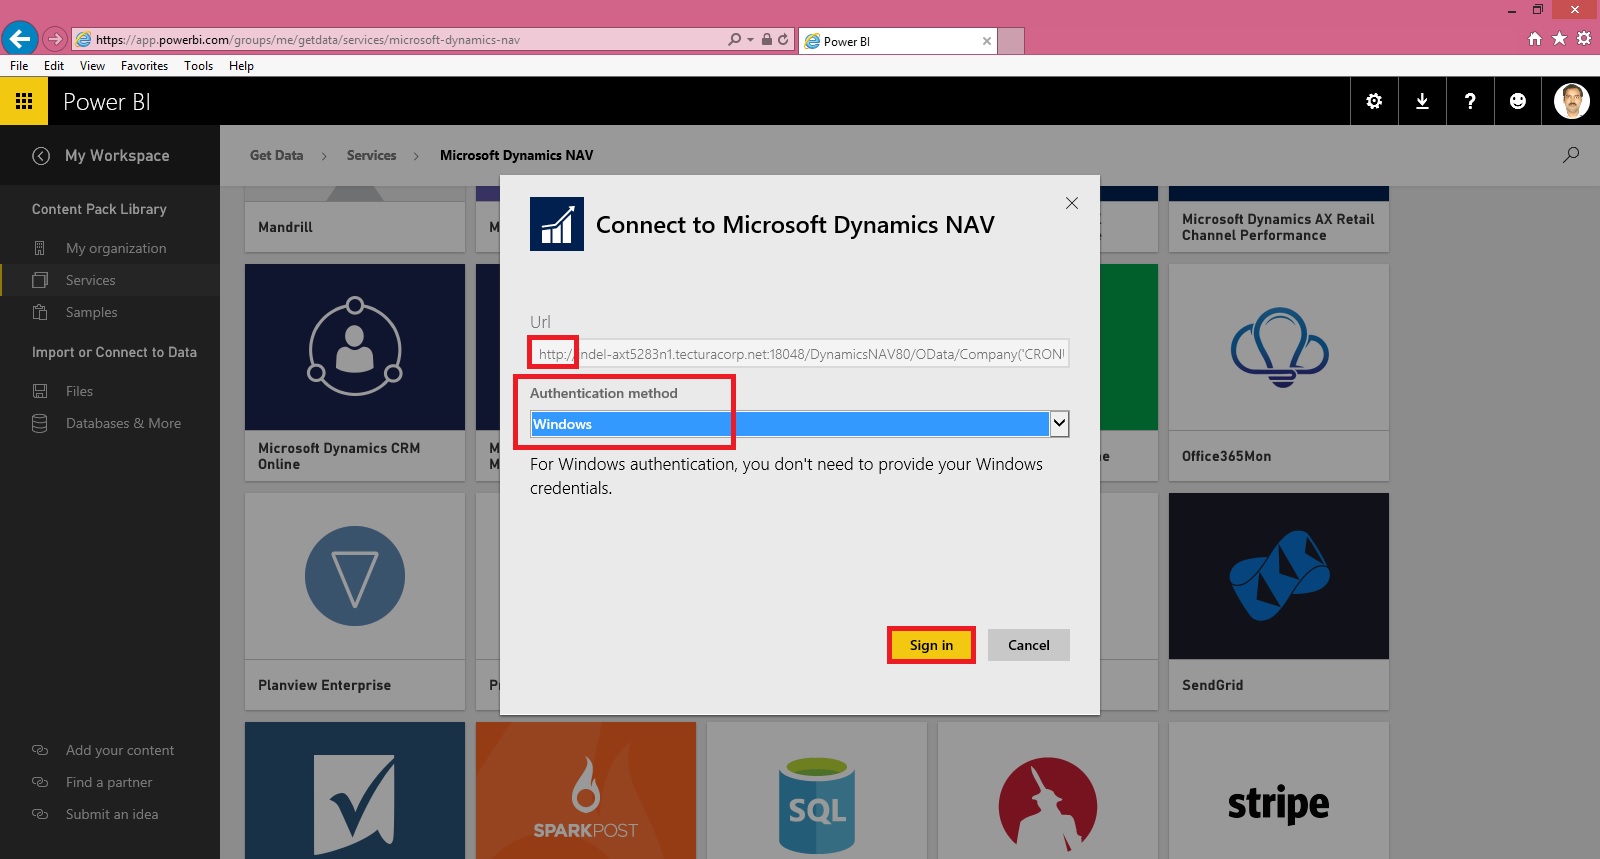
Connect Your Service using MS Dynamics Content Pack.

PowerBI-91

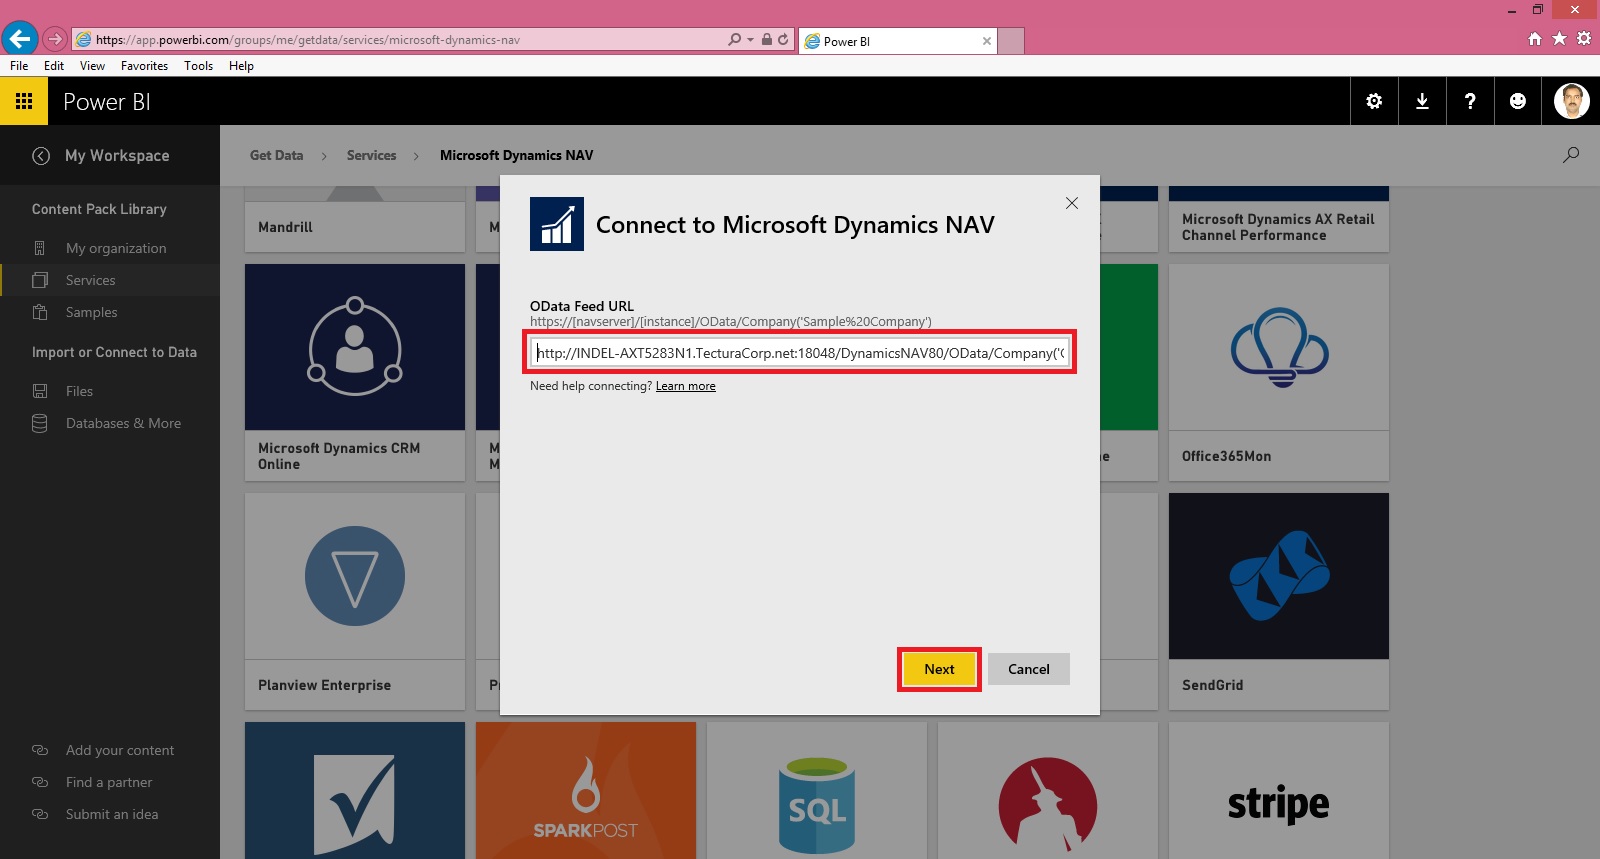
PowerBI-92

Notice here I am not using https:// also remove any ‘/’ and Service name from the URL.

PowerBI-93

Set your Authentication Mode and Sign In.

PowerBI-94

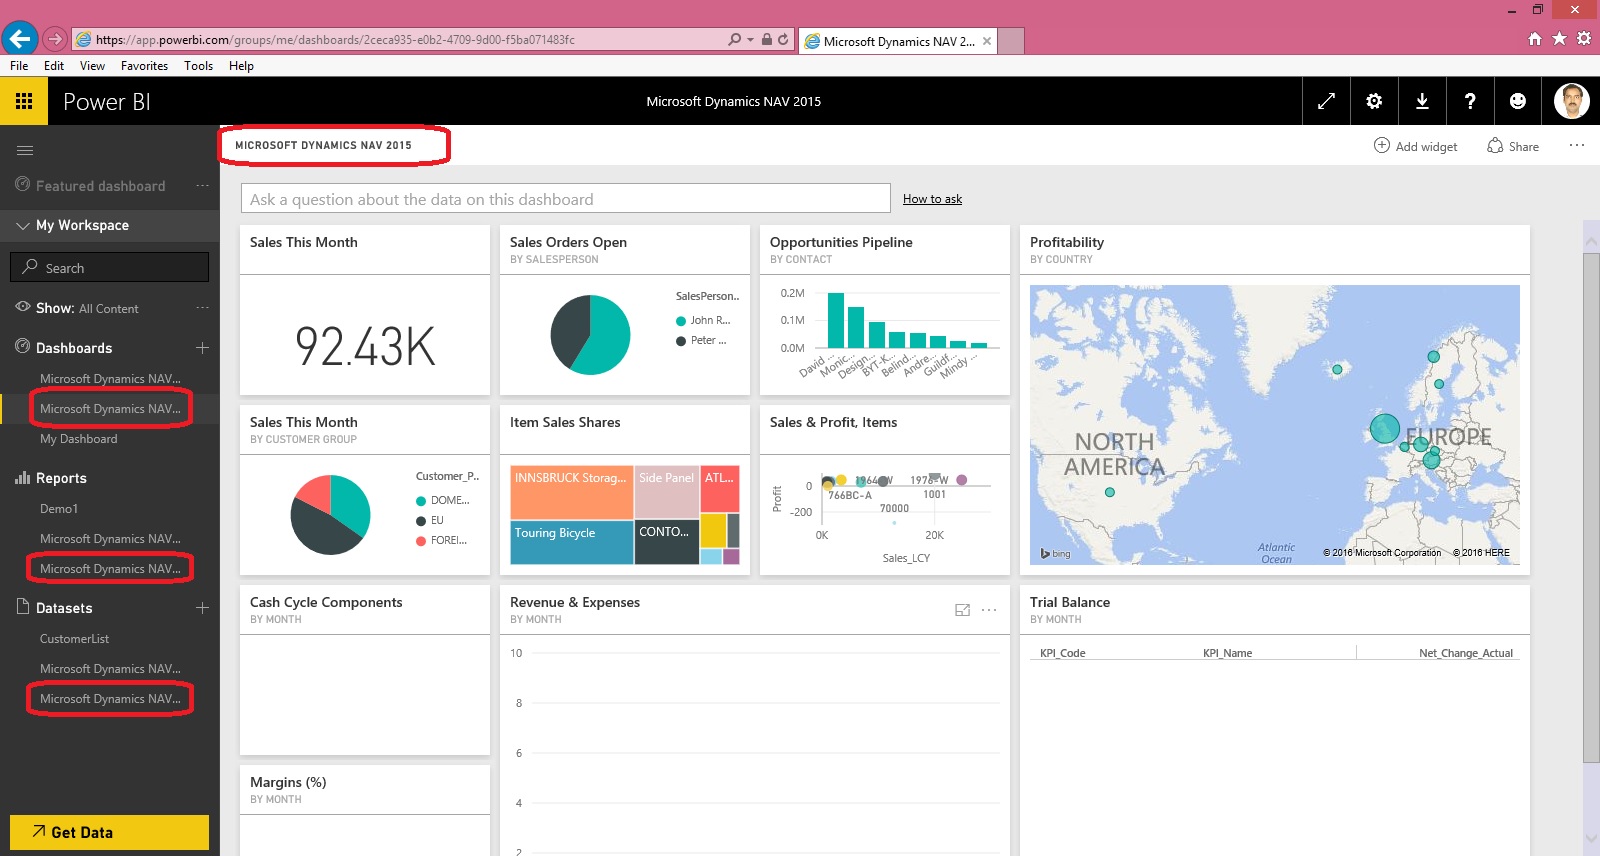
It will take some moment and your Dataset, Report & Dashboard will be available to you.

Graphical representation and data may vary depending upon data in your database.

We are done.

For further detail on any step you can refer previous posts for any clarifications, Links provided above.

Will come up with more details in my upcoming posts.

Till then keep trying and practicing.


Friday, 25 March 2016

BI Advantage (“Reporting” and “Cubes”) Jet Reports

“Reporting” and “Cubes”: The Best of Both Worlds
Video-1

http://jetreports.wistia.com/medias/ai8jnon1nf?embedType=iframe&seo=false&videoWidth=640

Video-2

http://jetreports.wistia.com/medias/0w88iu3tg2?embedType=iframe&seo=false&videoWidth=640

BI Advantage (Account Schedules in NAV) Jet Reports

Using BI to Get the Most out of Account Schedules in NAV

Video-1

http://jetreports.wistia.com/medias/ggbxryzper?embedType=iframe&seo=false&videoWidth=640

Video-2

http://jetreports.wistia.com/medias/530rukjk1p?embedType=iframe&seo=false&videoWidth=640

BI Advantage (Reporting to Business Intelligence) Jet Reports

Graduating from Reporting to Business Intelligence

Video-1

http://jetreports.wistia.com/medias/rh3i0aunwm?embedType=iframe&seo=false&videoWidth=640

Video-2

http://jetreports.wistia.com/medias/b9xq4oj335?embedType=iframe&seo=false&videoWidth=640

BI Advantage (Web Based Dashboards ) Jet Reports

Web Based Dashboards Provide Insight from Anywhere

Video-1

http://jetreports.wistia.com/medias/9uesa3dfes?embedType=iframe&seo=false&videoWidth=640

Video-2

http://jetreports.wistia.com/medias/dbeyjnvo8t?embedType=iframe&seo=false&videoWidth=640

BI Advantage (The 5 Minute Dashboard ) Jet Reports

The 5 Minute Dashboard - It's Easier than You Think

Video-1

http://jetreports.wistia.com/medias/c9vnu6qmpb?embedType=iframe&seo=false&videoWidth=640

Video-2

http://jetreports.wistia.com/medias/pit9fq9wx0?embedType=iframe&seo=false&videoWidth=640